About reporting for Smart+ creatives
Note: This feature may not be available to you yet. Reach out to your TikTok account manager or contact customer support for more information.
With enhanced creative-centric reporting for Smart+ campaigns, you can access robust performance data at the combination and creative element level, helping you to scale effective creative approaches in the future. Specifically, you can analyze performance across 3 dimensions: creative, text, and enhancement (for example, CTA, creative add-ons, and other engagement triggers).
Tip: Learn more about reporting updates for the upgraded Smart+ experience.
Benefits
Easily access granular creative performance data that reveals which creative elements and combinations drive results, empowering you to scale their best-performing content strategies with confidence.
Key features
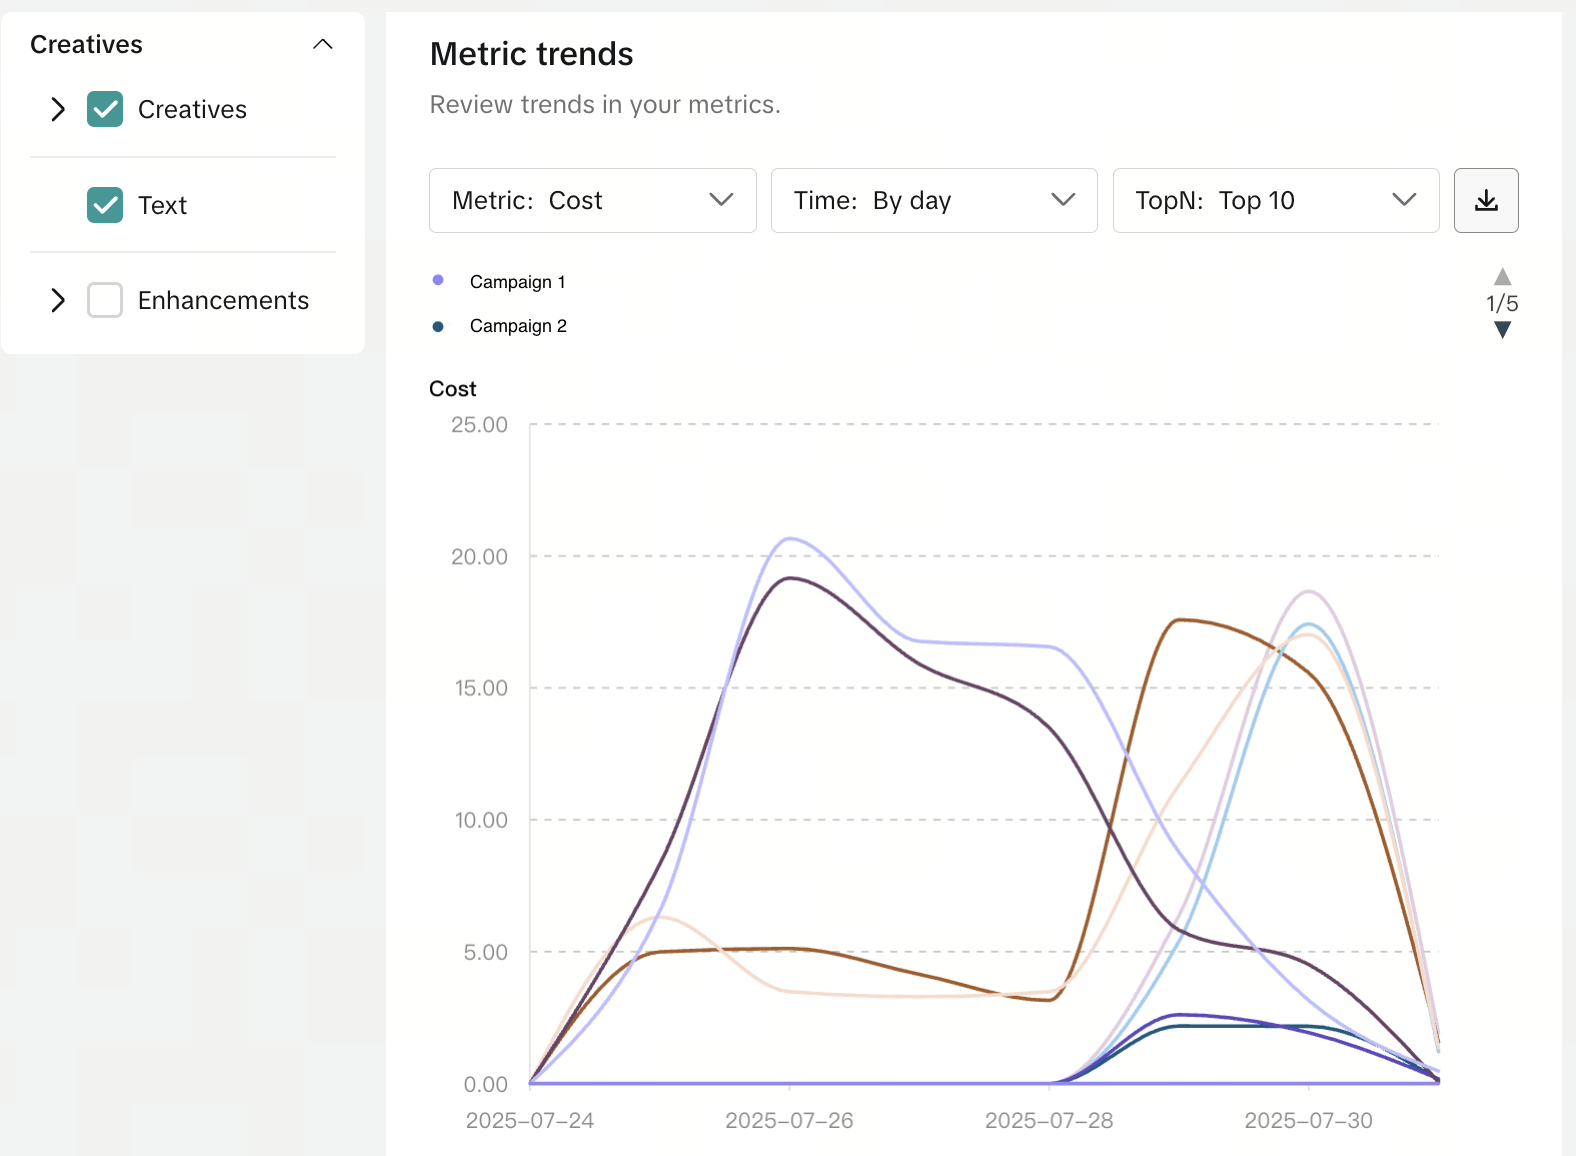
Reporting dimensions and filtering:
For creative insights, there are 3 dimensions you can filter and analyze performance by:
Creative
Video: Video, Post
Image: Carousel, Post Carousel
Catalog: Catalog video, Catalog carousel, Template catalog carousel
Text
Enhancement: CTA, Add-ons, AIGC
You can use all 3 dimensions at once to define combinations that you want to look into. You can also filter the sub-dimensions to view the performance of more combinations at a time. For example, if you select "Creative = Video, Post", "Text", "Enhancement=CTA", then the insight will display the following combinations in one chart:
Video x Text x CTA
Post x Text x CTA
Carousel x Text x CTA
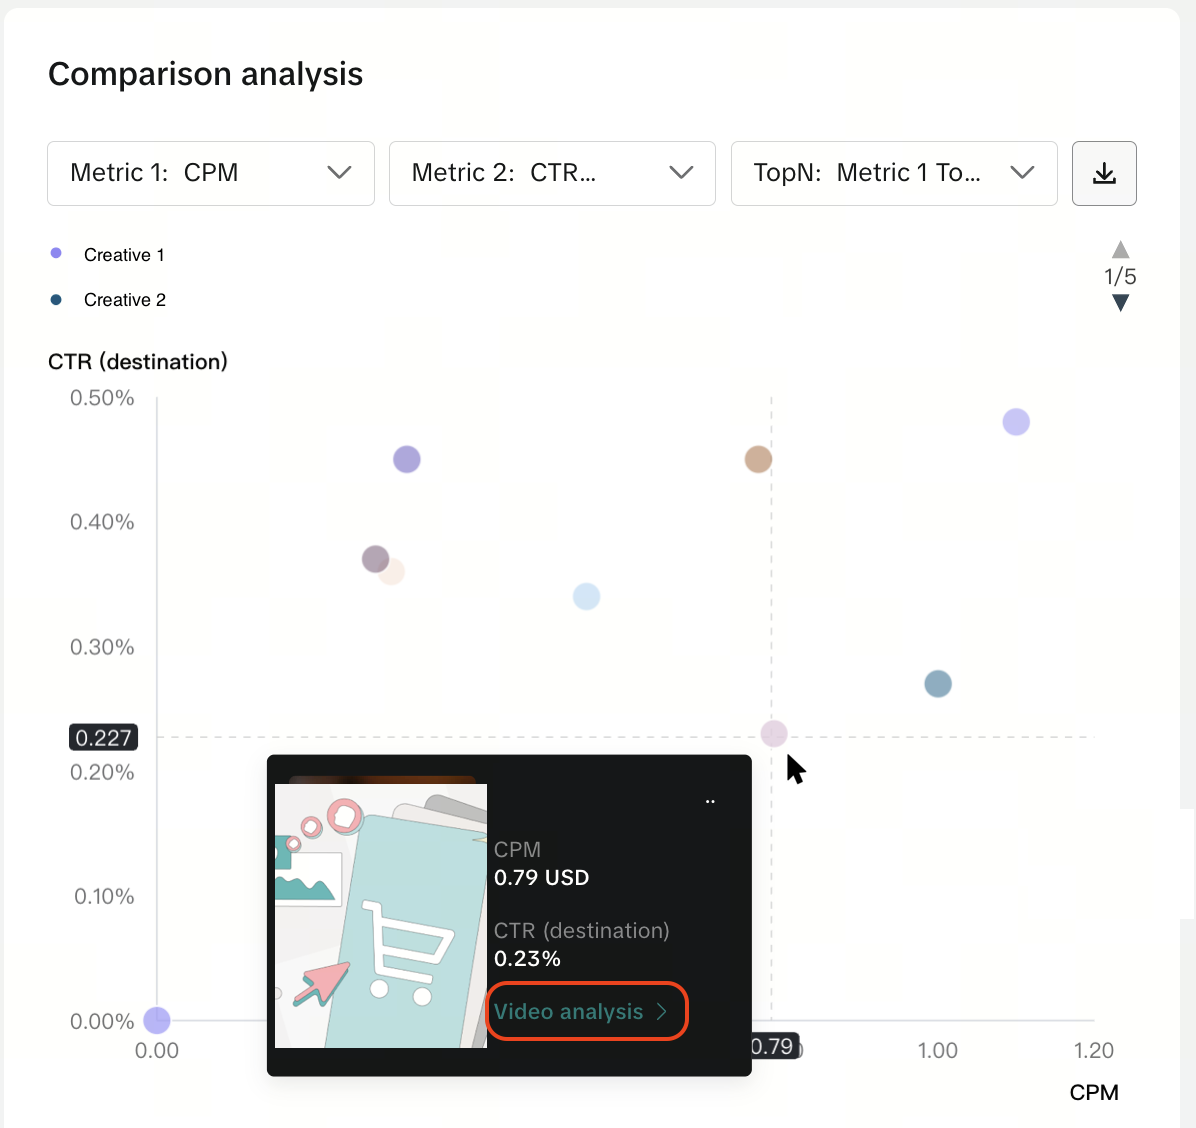
Comparison chart
The comparison chart feature lets you compare material combinations/creative sets across 3 metrics of your choice. When you hover over an object on the comparison chart, you'll see the applicable creative, text, enhancement, and a link to a video analysis (for the creative dimension).
Next steps
You can access creative-centric reporting from the Campaigns tab in TikTok Ads Manager. Select the Smart+ campaign you want to view insights for, then choose View report. Click the Insights tab to view the metrics trends and comparison chart.