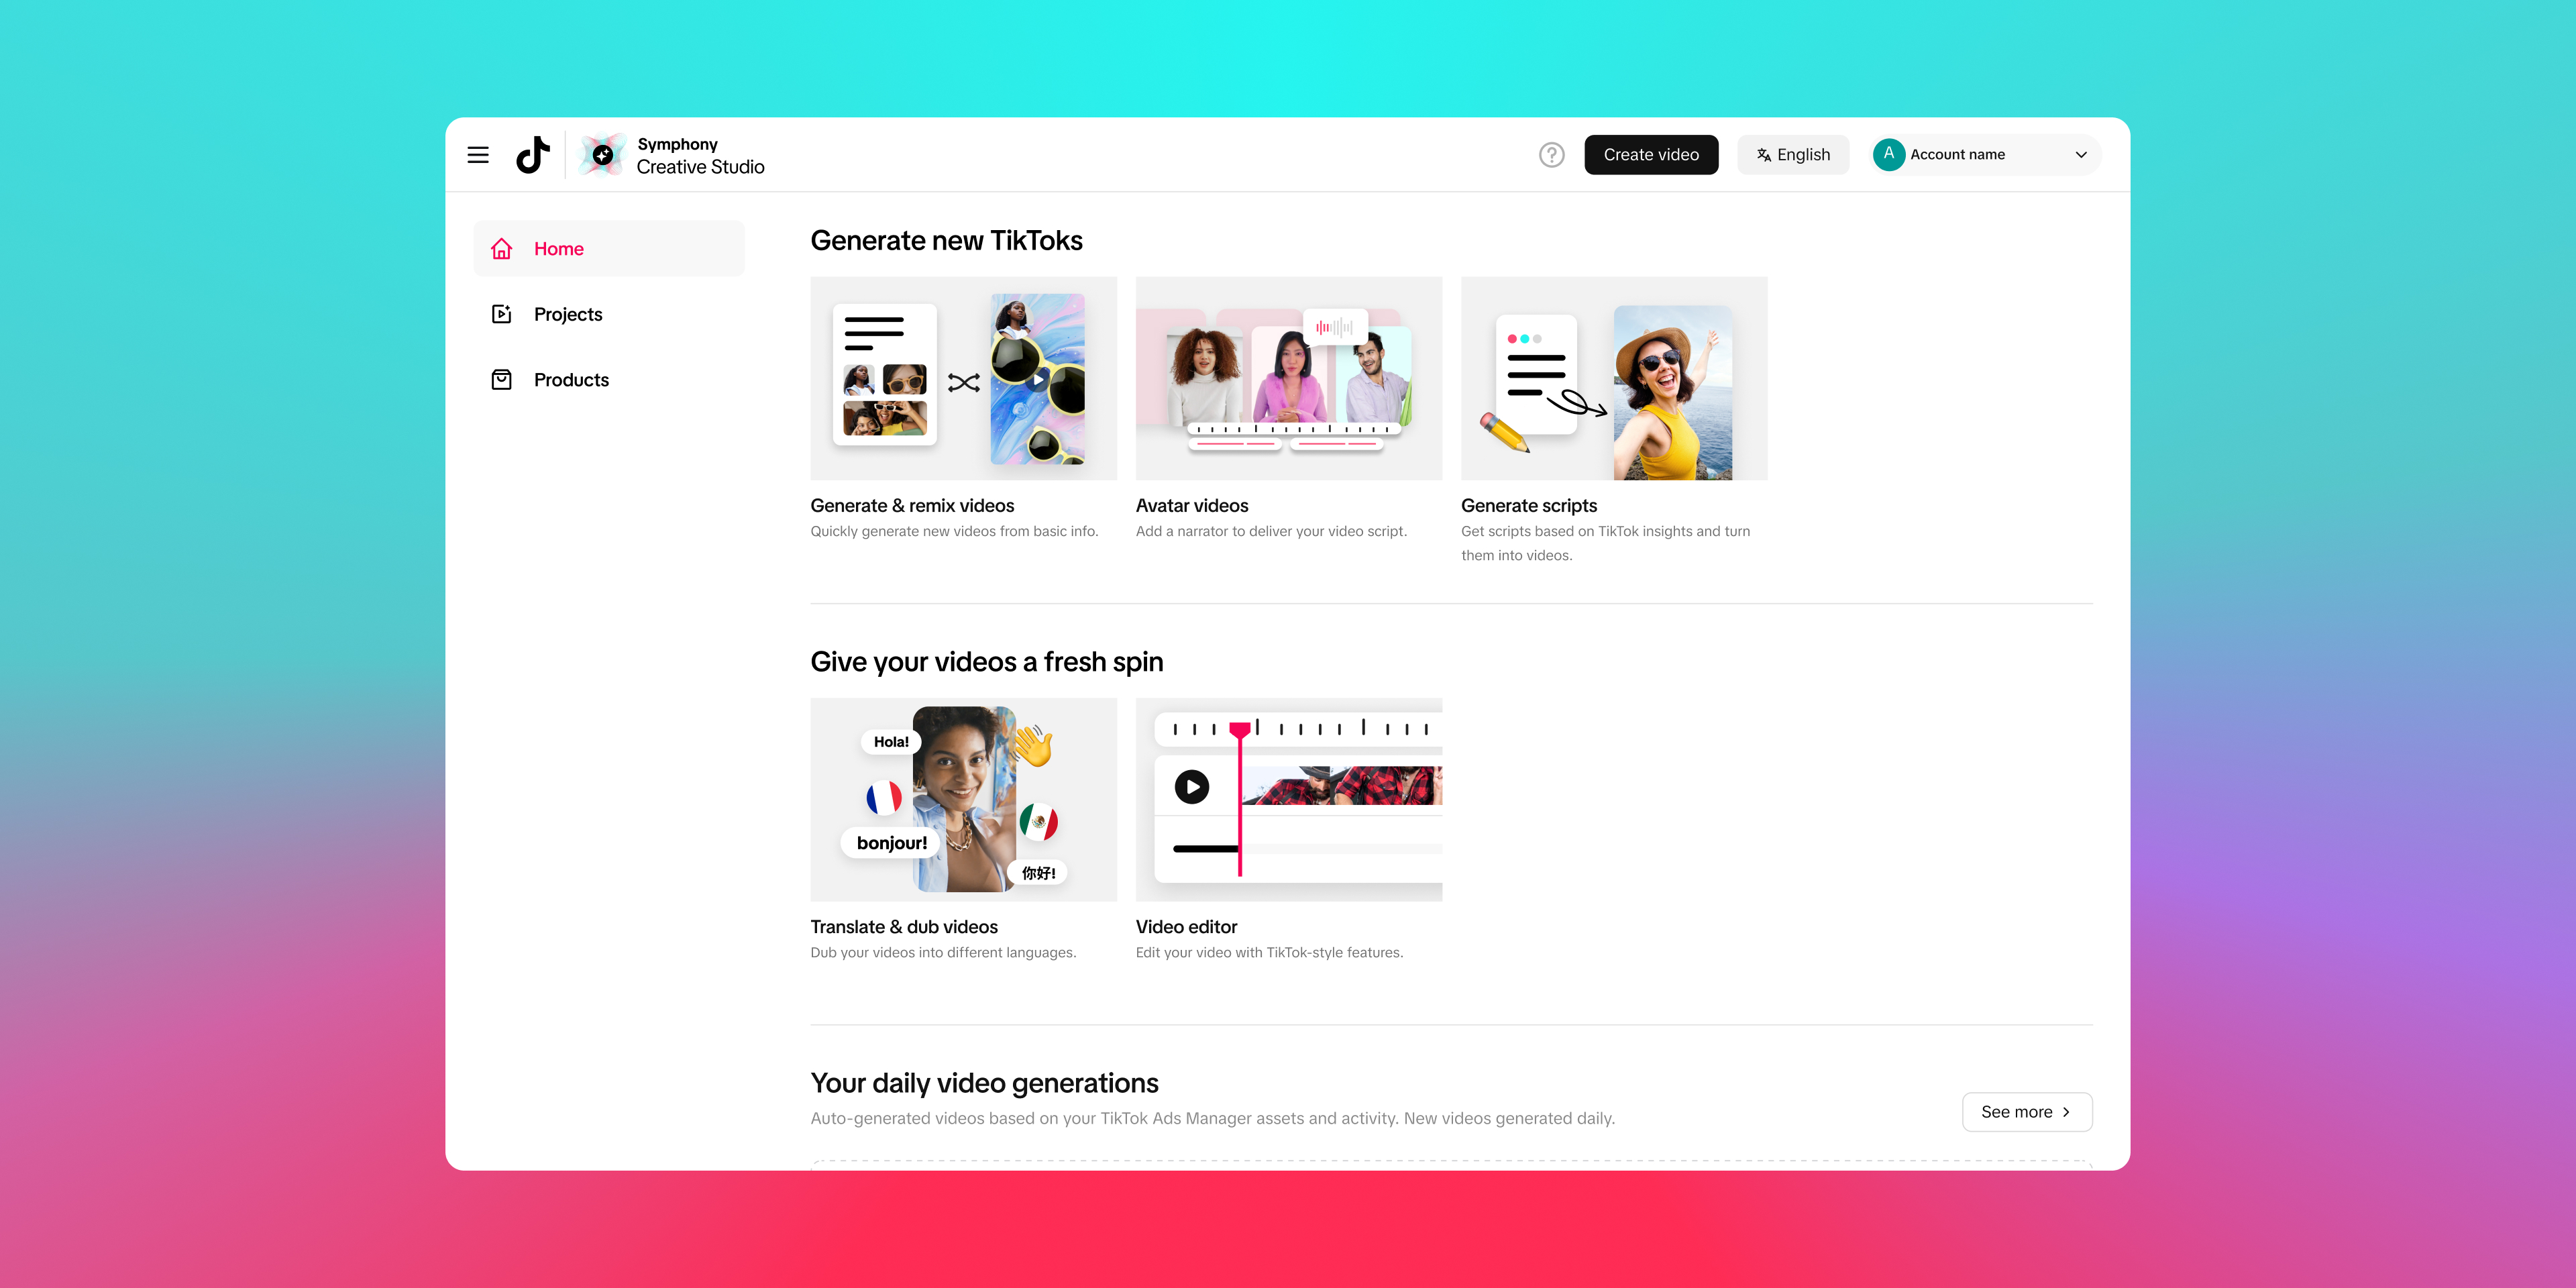
Let’s elevate your whole creative game


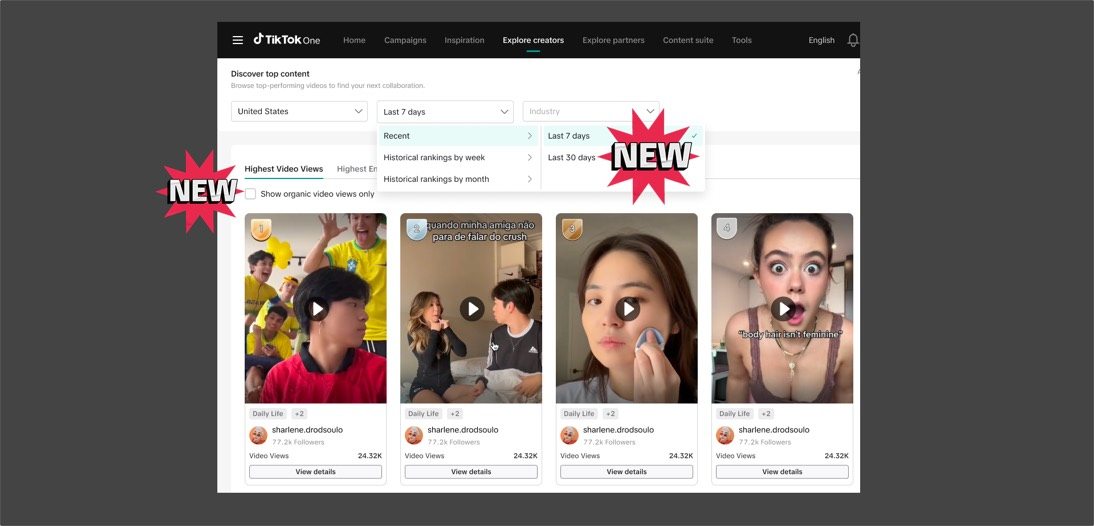
New features on “top content” page
Now you can filter high-performance content by flexible time periods and organic traffic.
Learn more
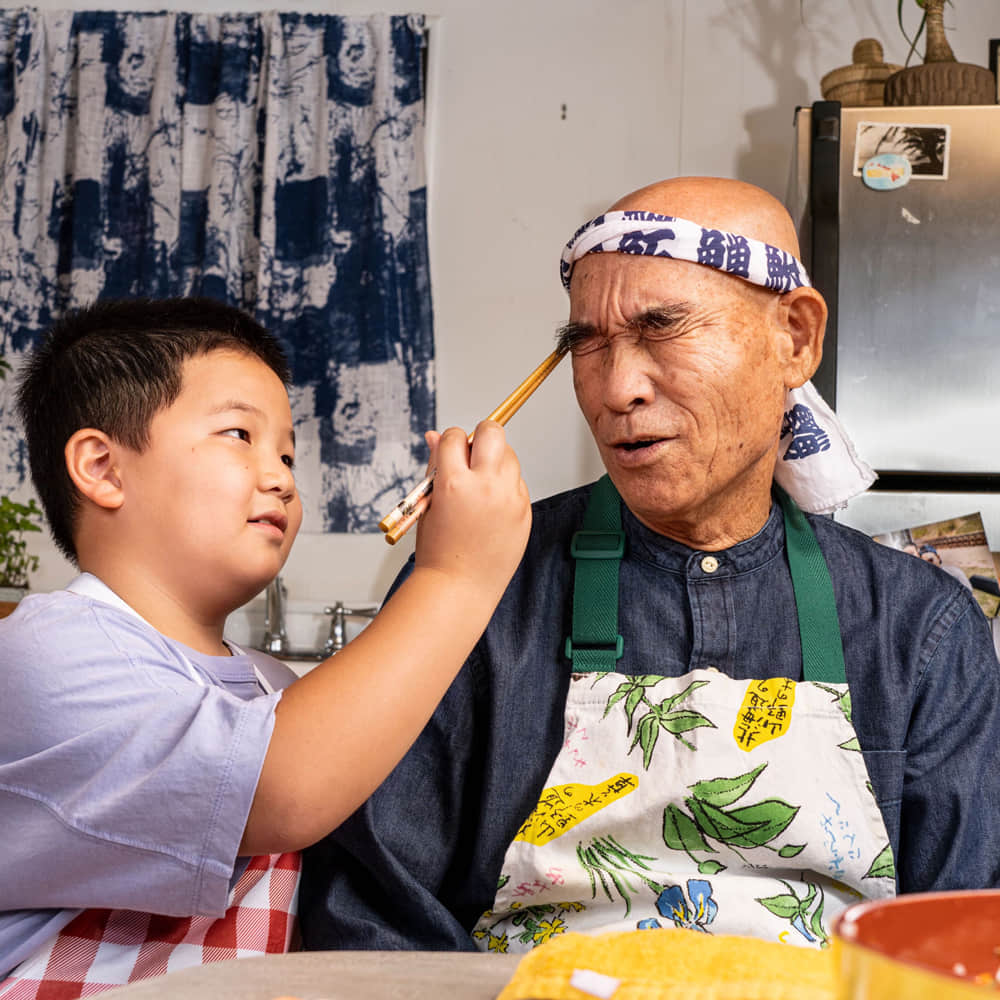
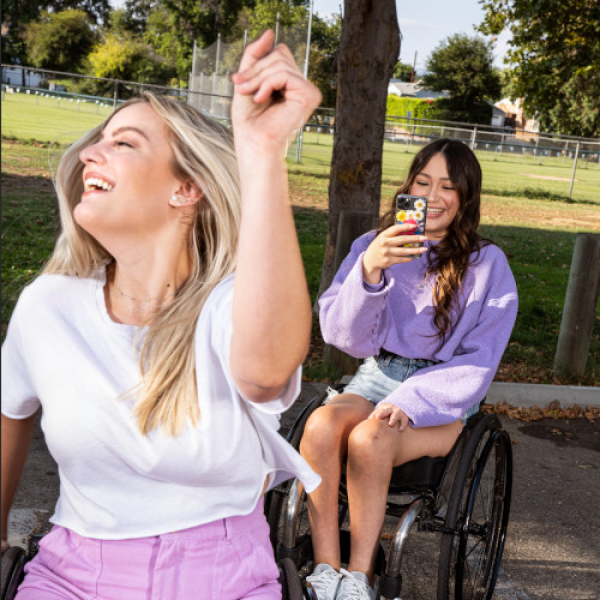
Creator Highlights
With TikTok One, teaming up with the most innovative and trend-setting creators has never been easier. Unleash bold, groundbreaking content that makes your brand impossible to ignore. Dive into our creator highlights to discover creators who are setting trends, sparking conversations, and redefining digital marketing. Turn today’s trends into tomorrow’s results.
Learn more

Trending in
undefined
Trend Discovery
Check out what's hot on TikTok
Discover what's buzzing on TikTok and get the scoop on the most popular hashtags, songs, creators, and videos in your region. Trend Discovery is here to inspire you, keep you in the loop, and maximize the success of your next TikTok video!
Hashtags
Songs
Creators
TikTok Videos
1
# outfitinspo
Apparel & Accessories
81KPosts
See analytics
2
# livemonetization
2KPosts
No related creator
See analytics
3
# artemisii
Education
13KPosts
No related creator
See analytics
4
27
# fitinspo
Apparel & Accessories
8KPosts
See analytics
5
# wendyortiz
News & Entertainment
3KPosts
No related creator
See analytics
1

Classic classical gymnopedie solo piano(1034554)
Lyrebirds music
Approved for business use
See analytics


Explore now
Latest content
Get the latest updates on Creative Center

Creative Strategies
Return On Influence: How Creators and Creative Variety Can Spark Performance
Learn more
Want to see us in your inbox?
Sign up for our TikTok for Business Newsletter to get the latest and greatest on all things advertising, commerce, and culture.

Thanks for your feedback !