How to view your campaign performance with TikTok Ads Manager
Reach diverse audiences around the world through TikTok For Business, an all in one marketing solutions platform

Are you running campaigns through TikTok Ads Manager but aren't sure how to get the right kind of performance data, delivered in the way you need?
In this article, we'll take a detailed look at TikTok Ads Manager's reporting tools, and how you can use them to quickly and easily understand how your campaign is doing. The insights gained from these tools can help you become a more effective and efficient data-driven marketer, leading to better campaign performance.
On TikTok Ads Manager, you have three methods or views for understanding your campaign's performance, each designed to provide you with different metrics depending on your needs.
Dashboard page: A bird's-eye view of your account.
Campaign page: Deep dive into performance by campaign.
Reporting page: Customisable performance reports sent directly to your inbox.
With the help of these three pages, you can quickly surface your campaign's performance story in just a few clicks. Keep reading to find out what these data tools are and how to use them.
1. Dashboard page: A bird's-eye view
The dashboard page is your top level view for getting a quick pulse of your performance across campaigns, ad groups and ads. The Dashboard page shows you up-to-date metrics, ad spend and the status of all your campaigns.
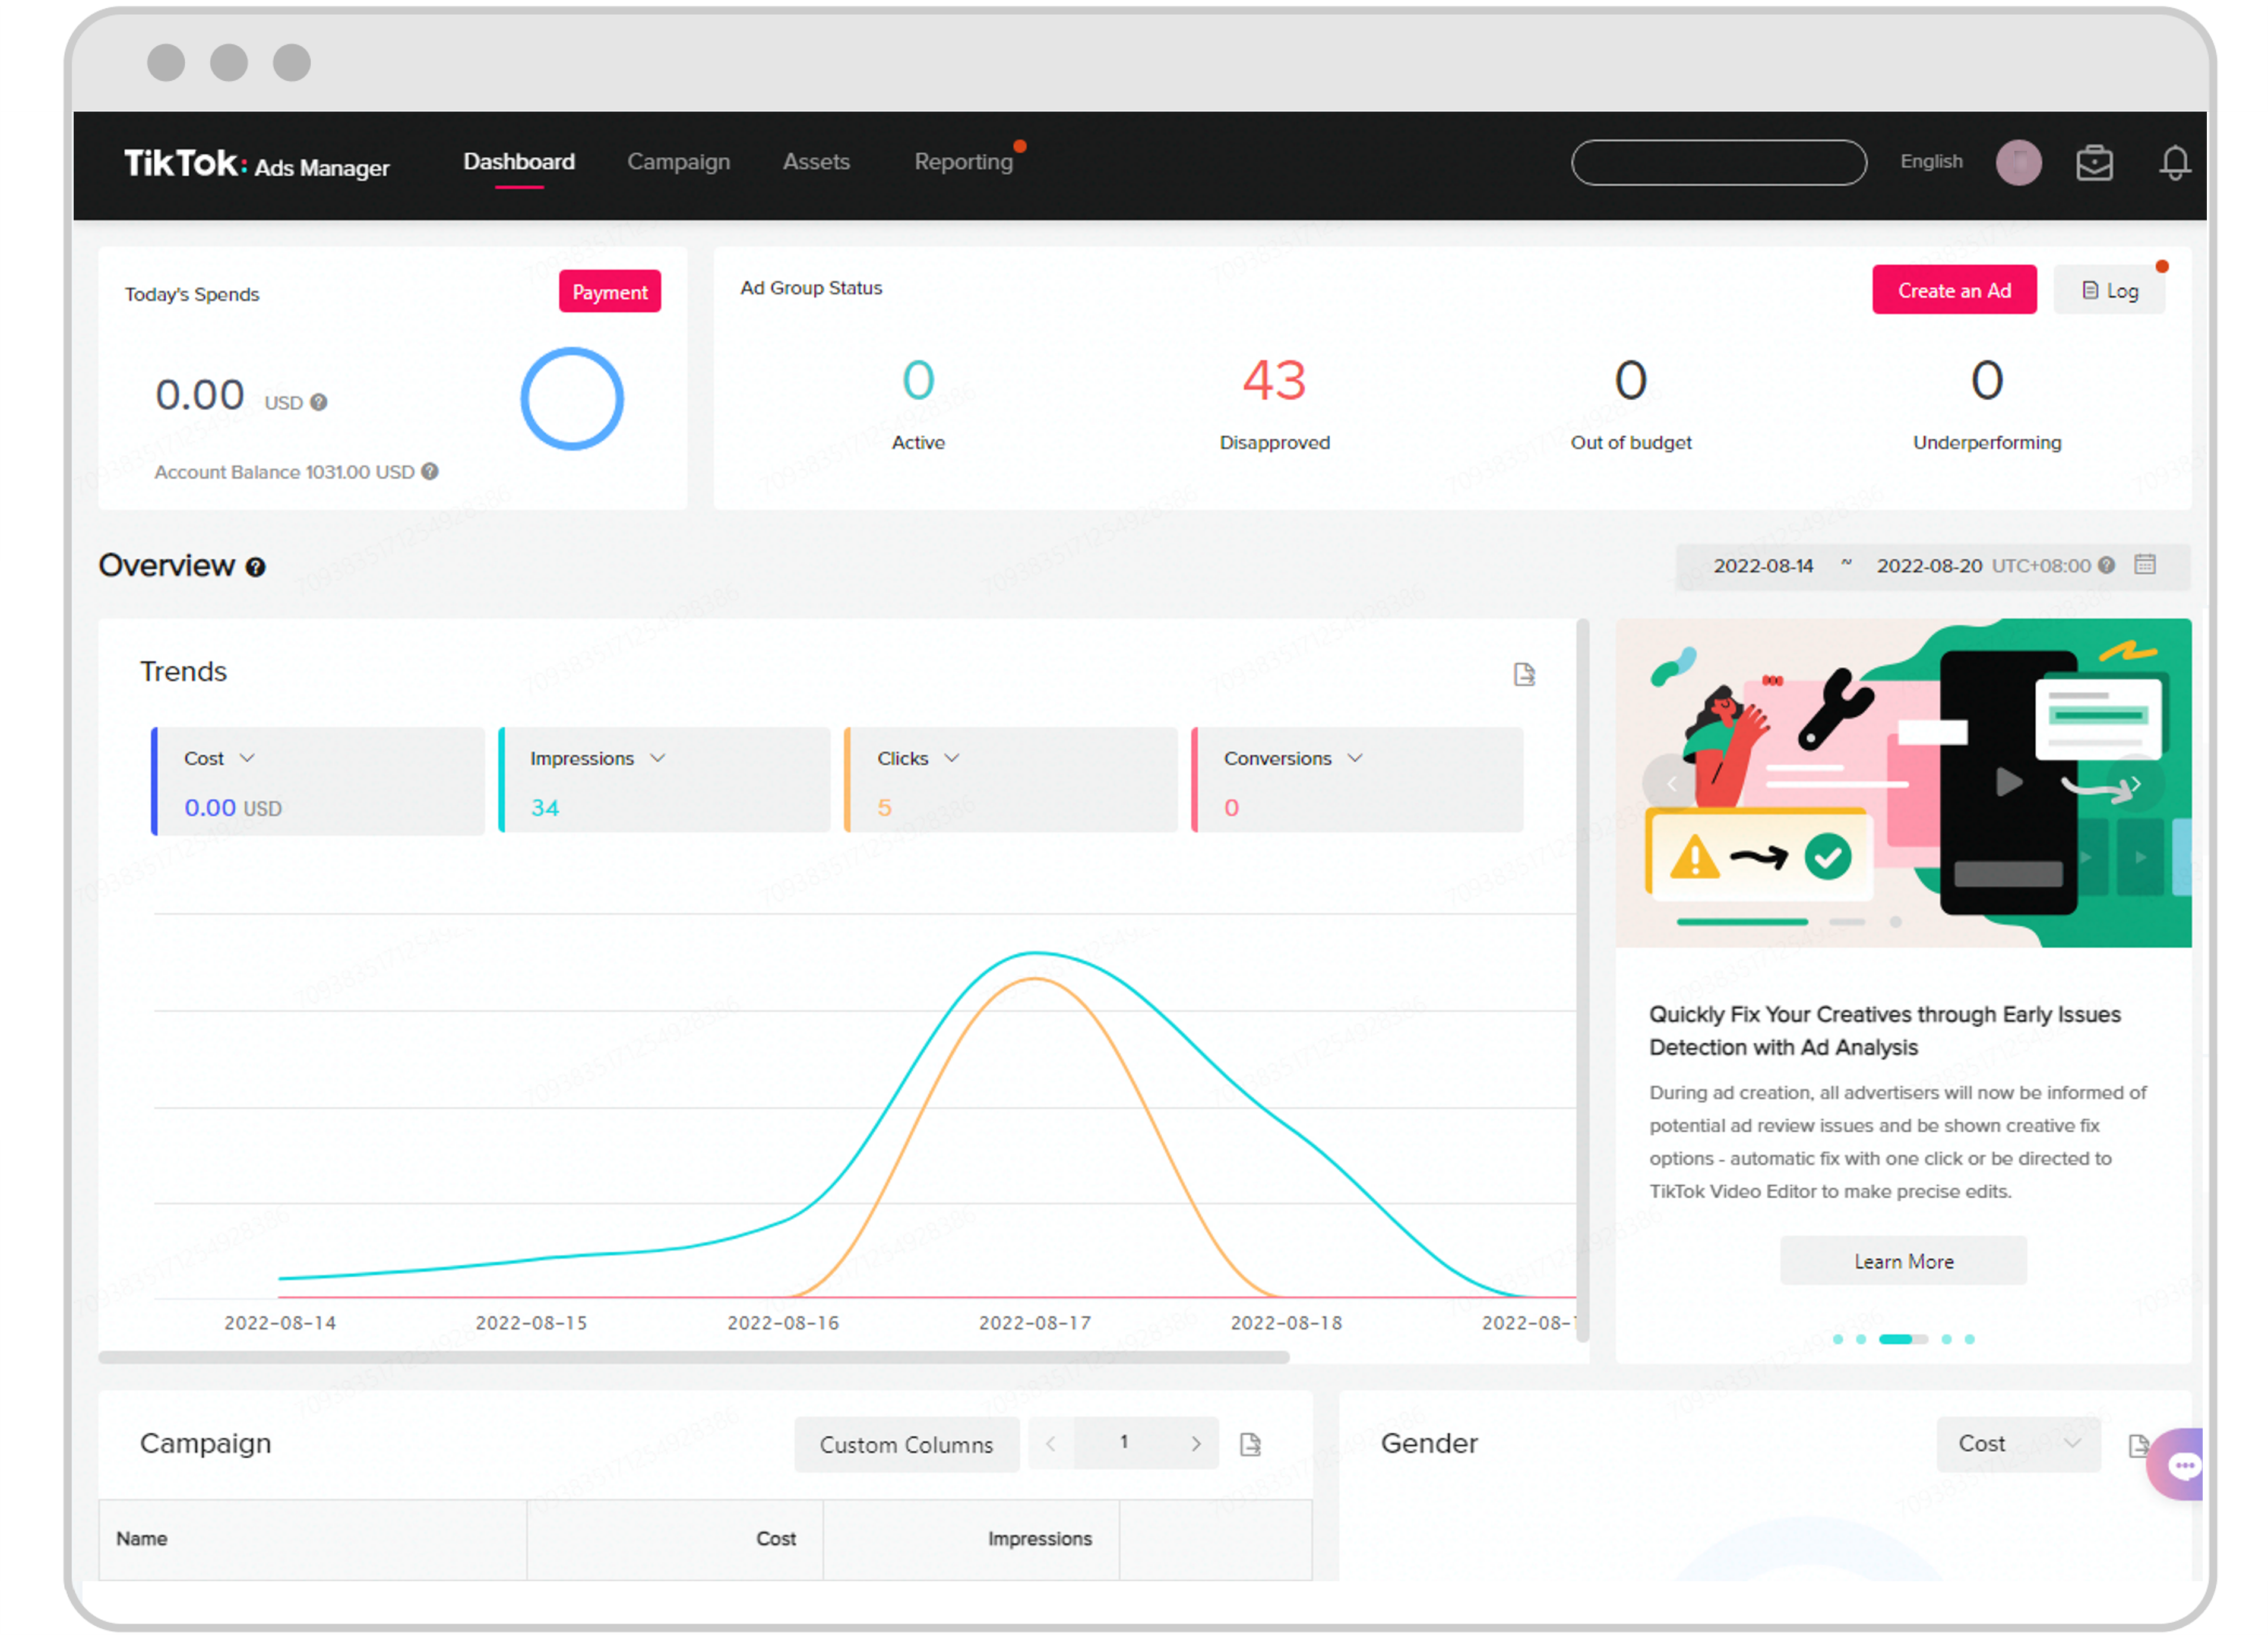
With this cross-account view, you can broadly assess the performance of your campaigns and quickly notice trends, spikes and other major indicators to further investigate.
Want to know what other pro marketers check for on the Dashboard page? Here are three useful tips:
Monitor the operation logs of your account by clicking the 'Log' link in the Ad Group Status area.
Check the status of all campaigns, ad groups and ads to ensure that ongoing ads are 'Active'.
View your performance metrics broken down by different dimensions (including demographics, operating system and dayparting).
2. Campaign page: Your performance microscope
Noticed an anomaly on the Dashboard? Want to filter for specific campaigns? Use the Campaign page to look into the details of your individual campaigns, ad groups and ads. Here's how to navigate the Campaign page and customise your campaign data view.
Search and filter for specific campaigns
Click the 'Campaign' tab at the top of the page to see a list of all your campaigns. Rather than wade through each row for a single campaign, use the 'Search' bar to find your campaign by name or ID. Aside from name and ID match, you can also click the 'Filter' button to select different criteria for the campaigns you want to focus on.
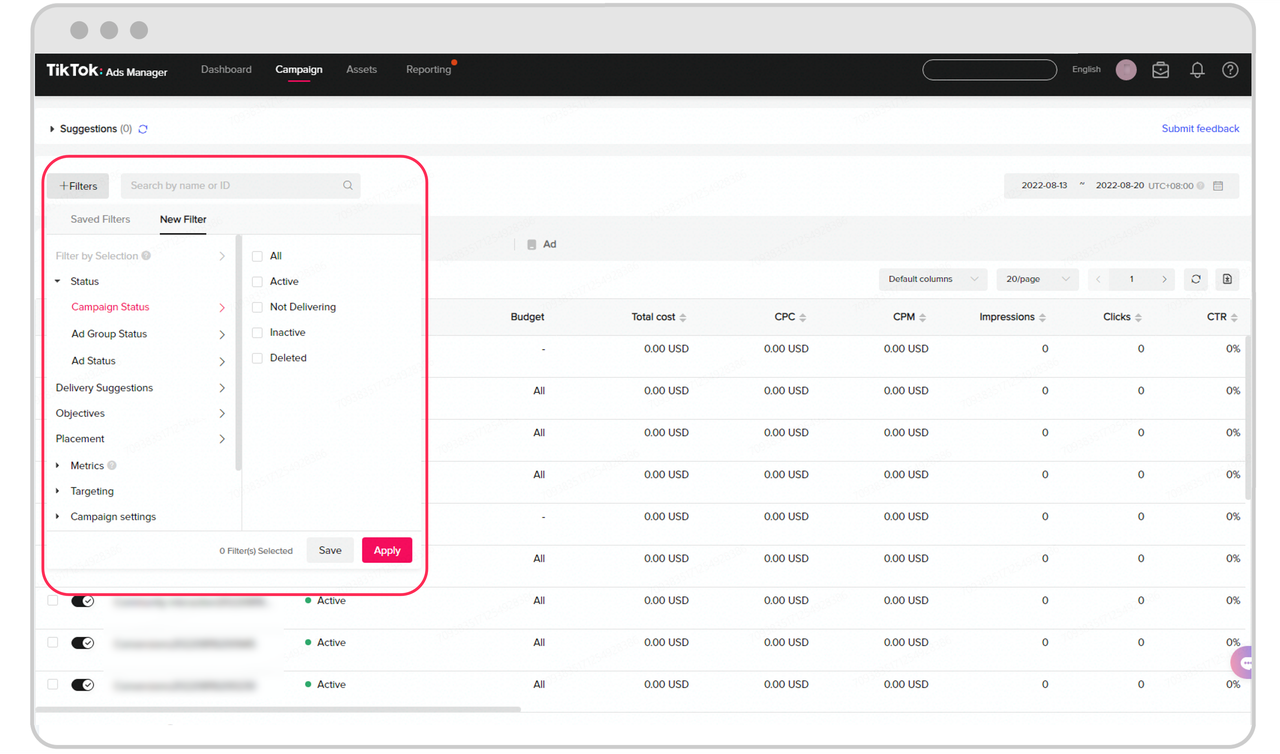
Customising your columns
Out-of-the-box, the Campaign view displays a table of broadly useful metrics, but it's fully customisable to show you the data you need. If you don't see the metrics you want, go to the 'Default Columns' dropdown and select 'Custom Columns'. Here you can tailor your view to your business's needs. Don't forget to save your column view at the end for quick access next time.
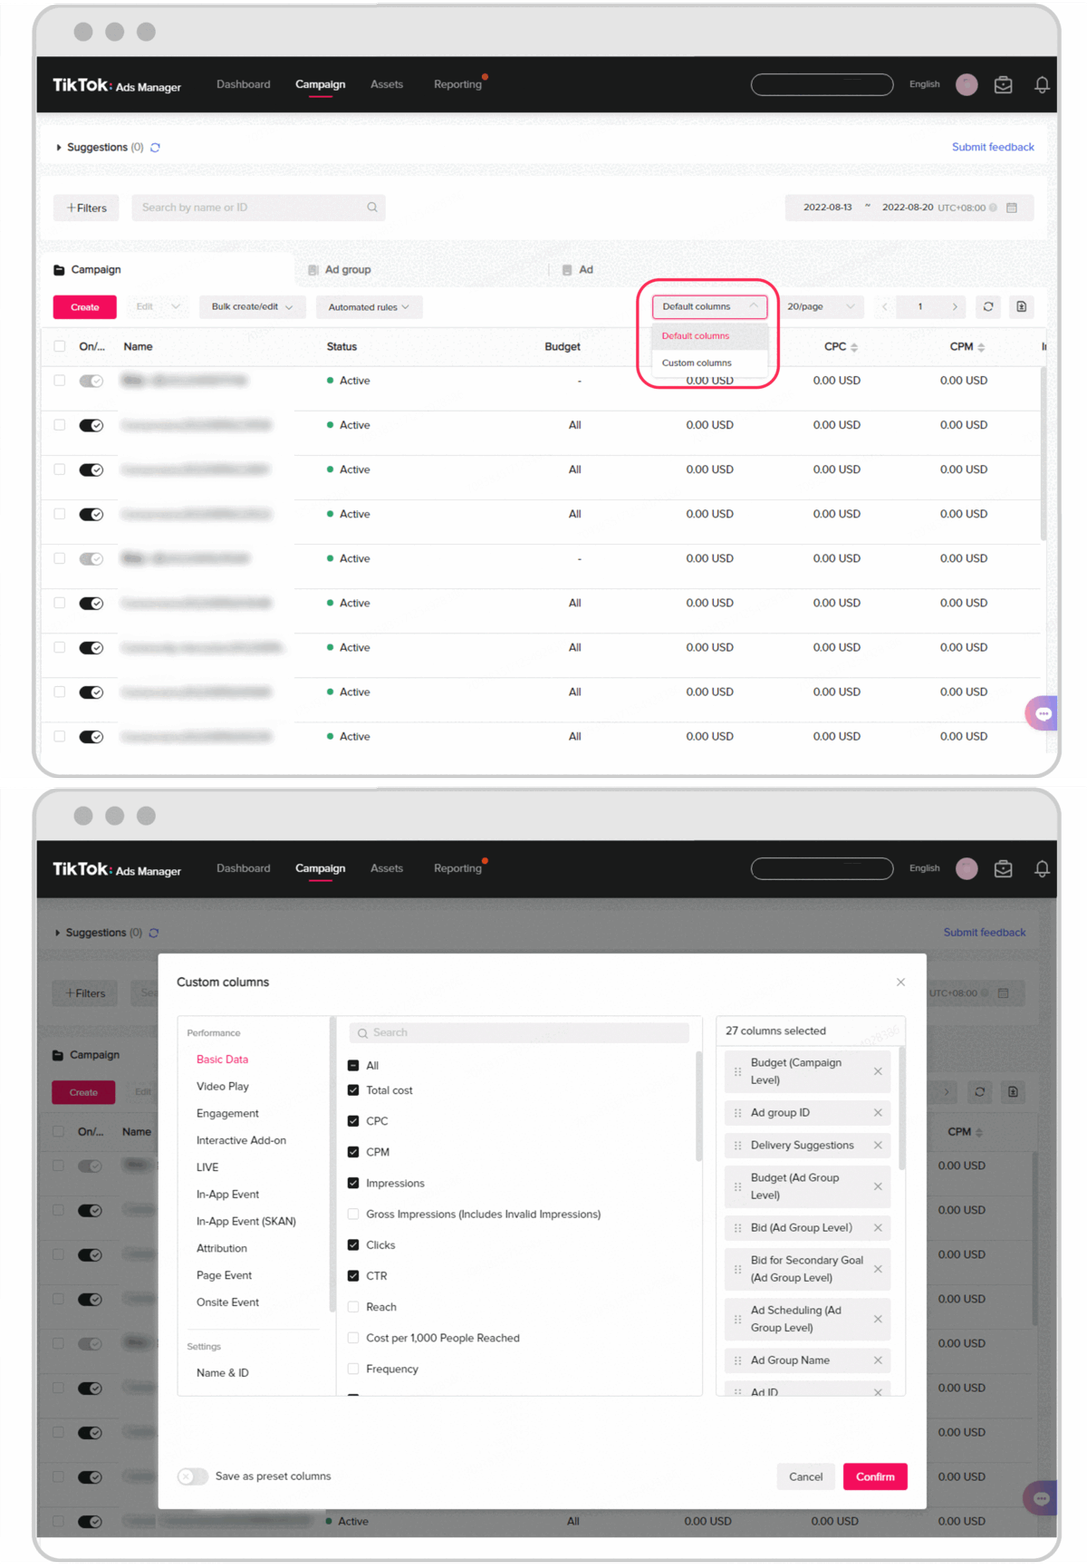
View Data to get performance details and audience breakdowns
Need to zoom into a campaign's performance even more? Click 'View Data' under each campaign, ad group or ad to view the performance data and audience analysis. You can customise the date and time range, then change the chart display by selecting daily or hourly data. Finish by picking the dimensions you want to see on your chart.
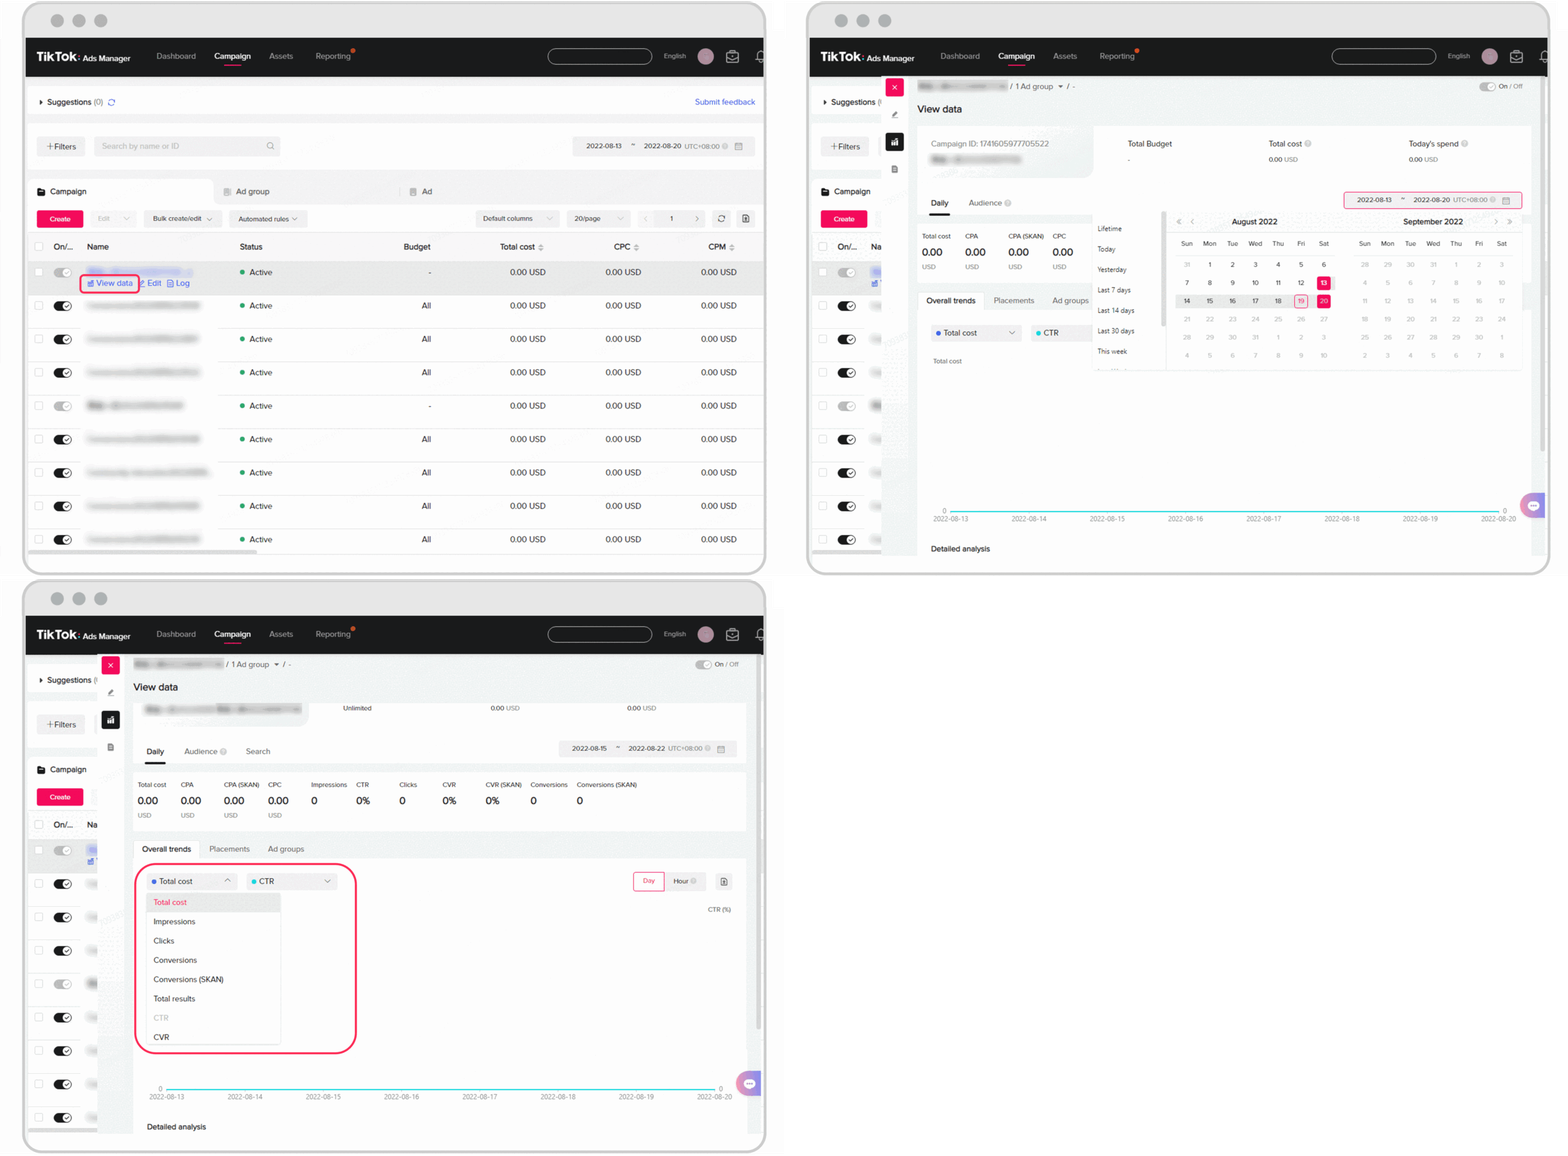
Click the 'Audience' tab to segment your performance data by audience. Dimensions include age, gender, location, interest and device.
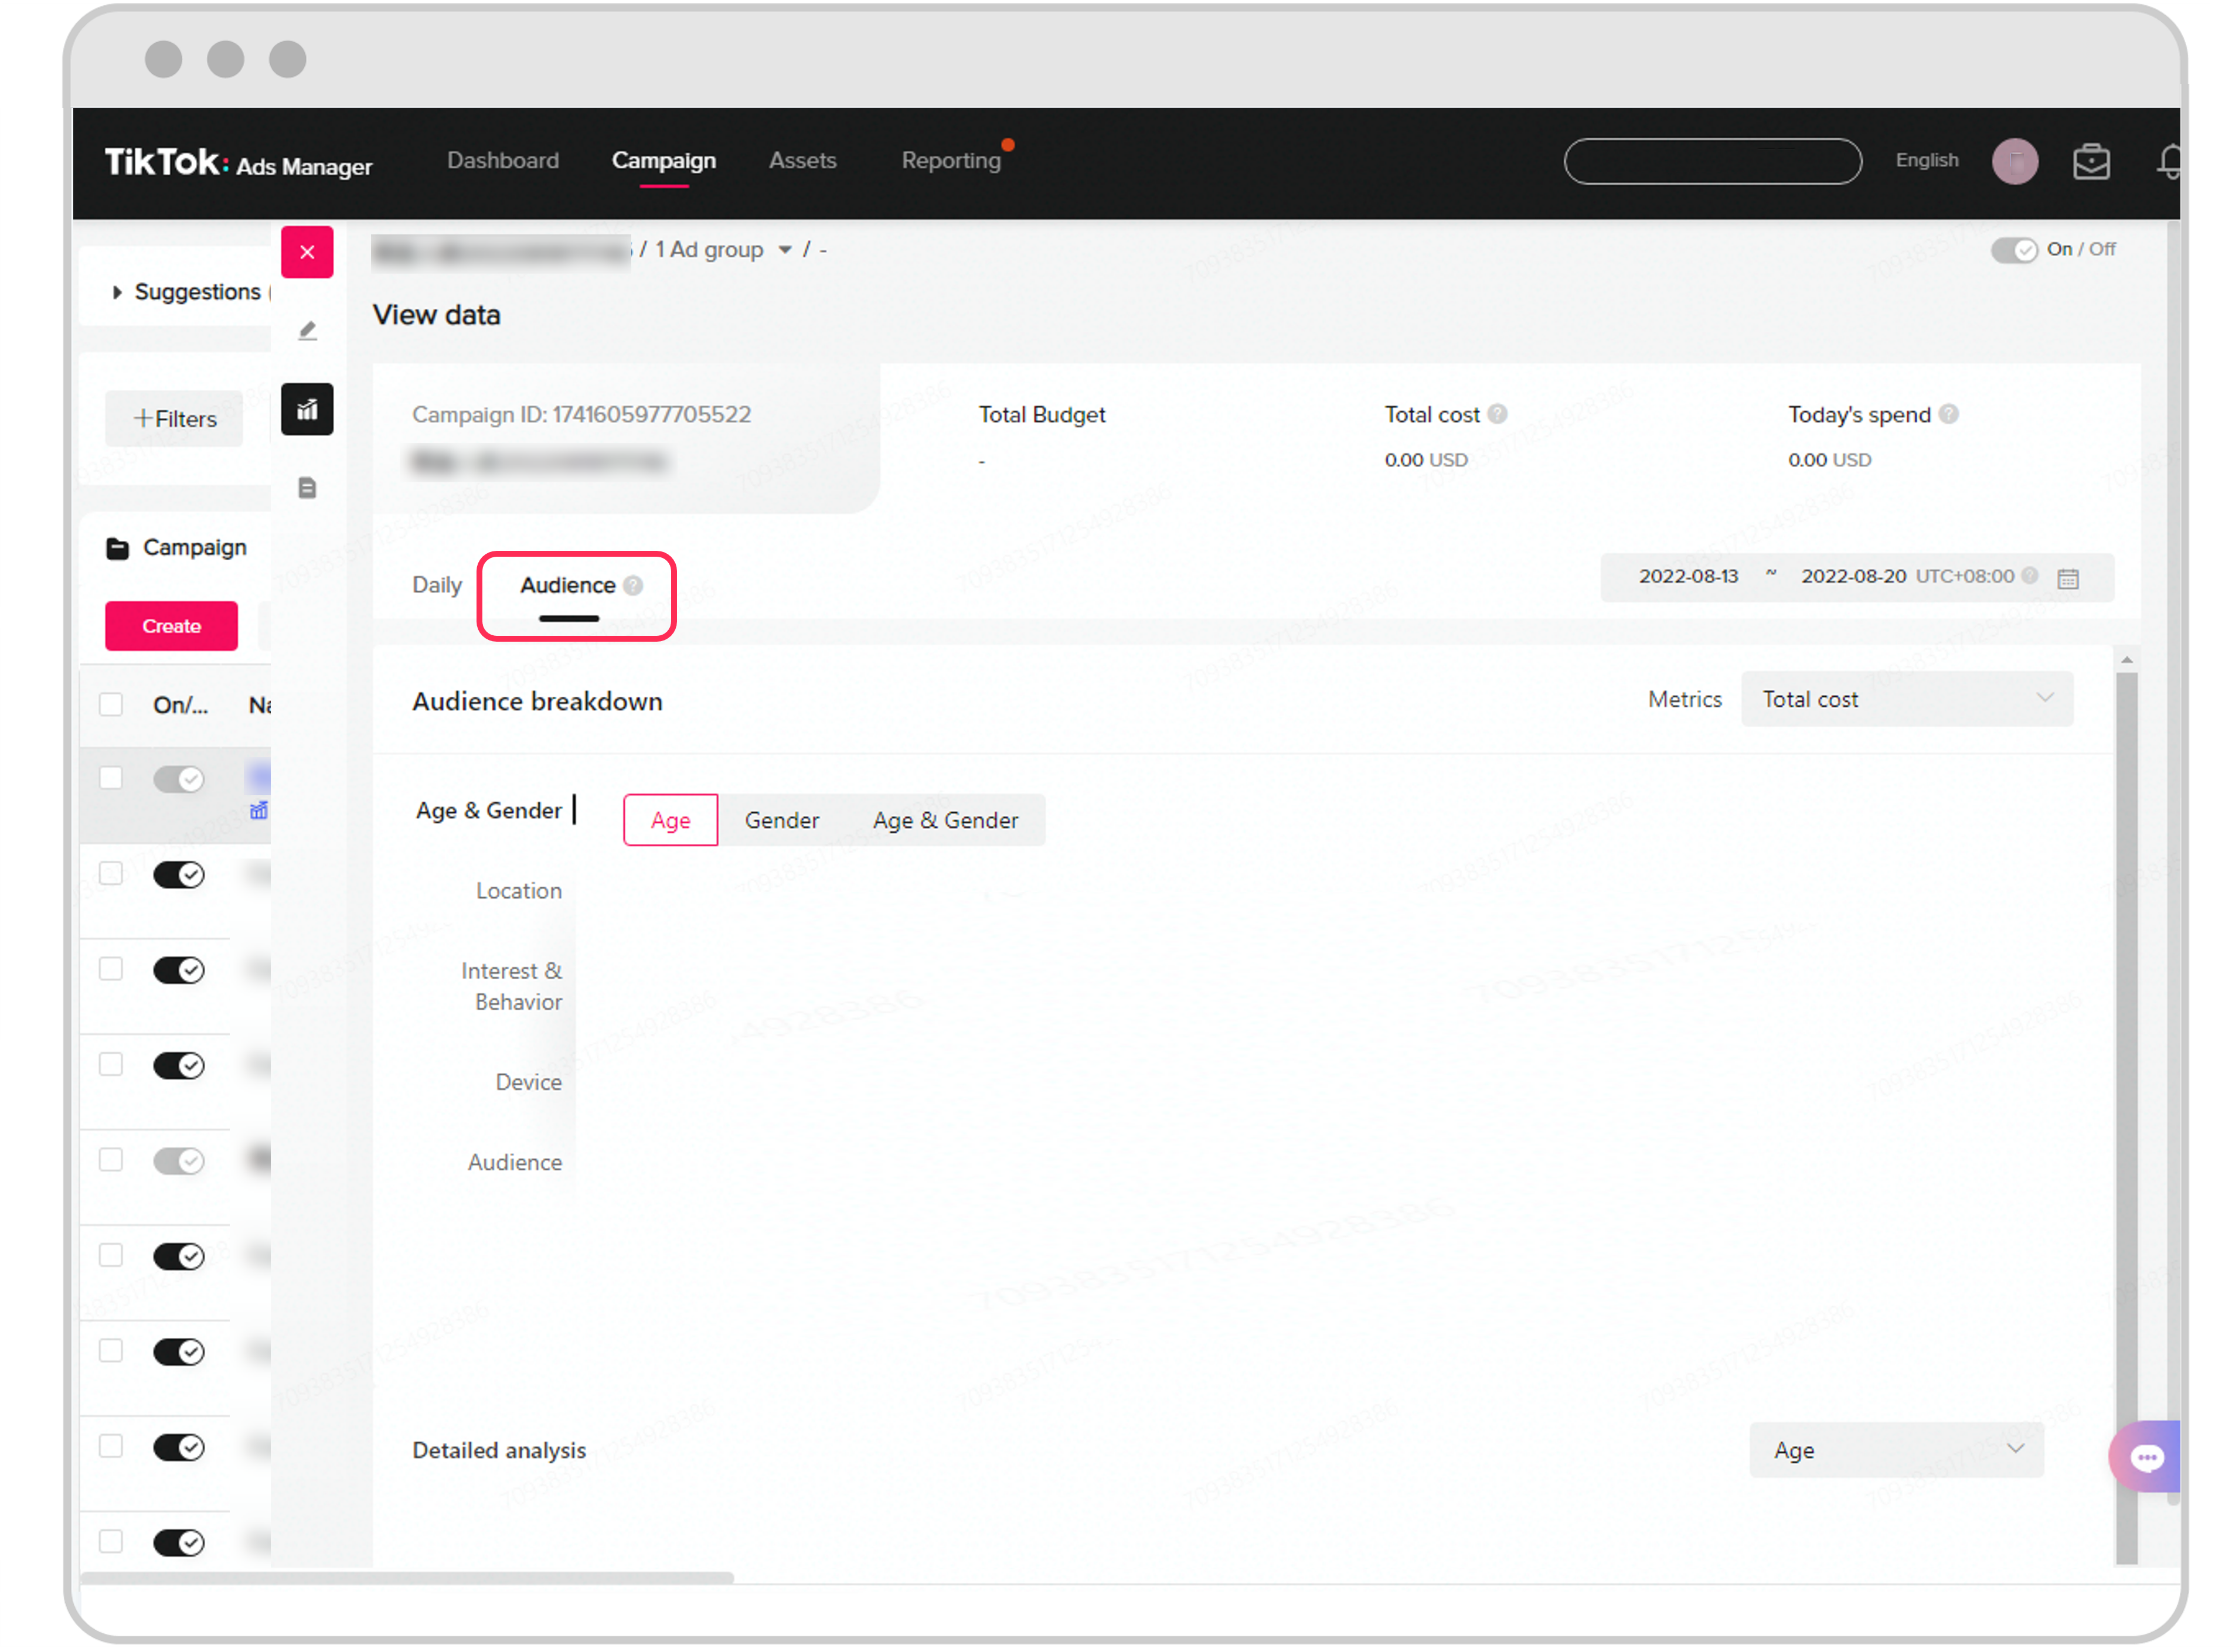
Don't forget to export any interesting data or cool storytelling charts to share with your team!
3. Reporting page: Results straight to your inbox
The Reporting page allows you to customise and manage the export and delivery of your reports on a schedule that works for you.
Create a report
A TikTok report is a customised, exported data spreadsheet that can easily be organized, analysed and put into tables and charts. Start by clicking on the 'Reporting' tab at the top of TikTok Ads Manager. Clicking on the 'Create' button will give you a drop-down menu to choose between a 'Custom Report' or 'From Template'.
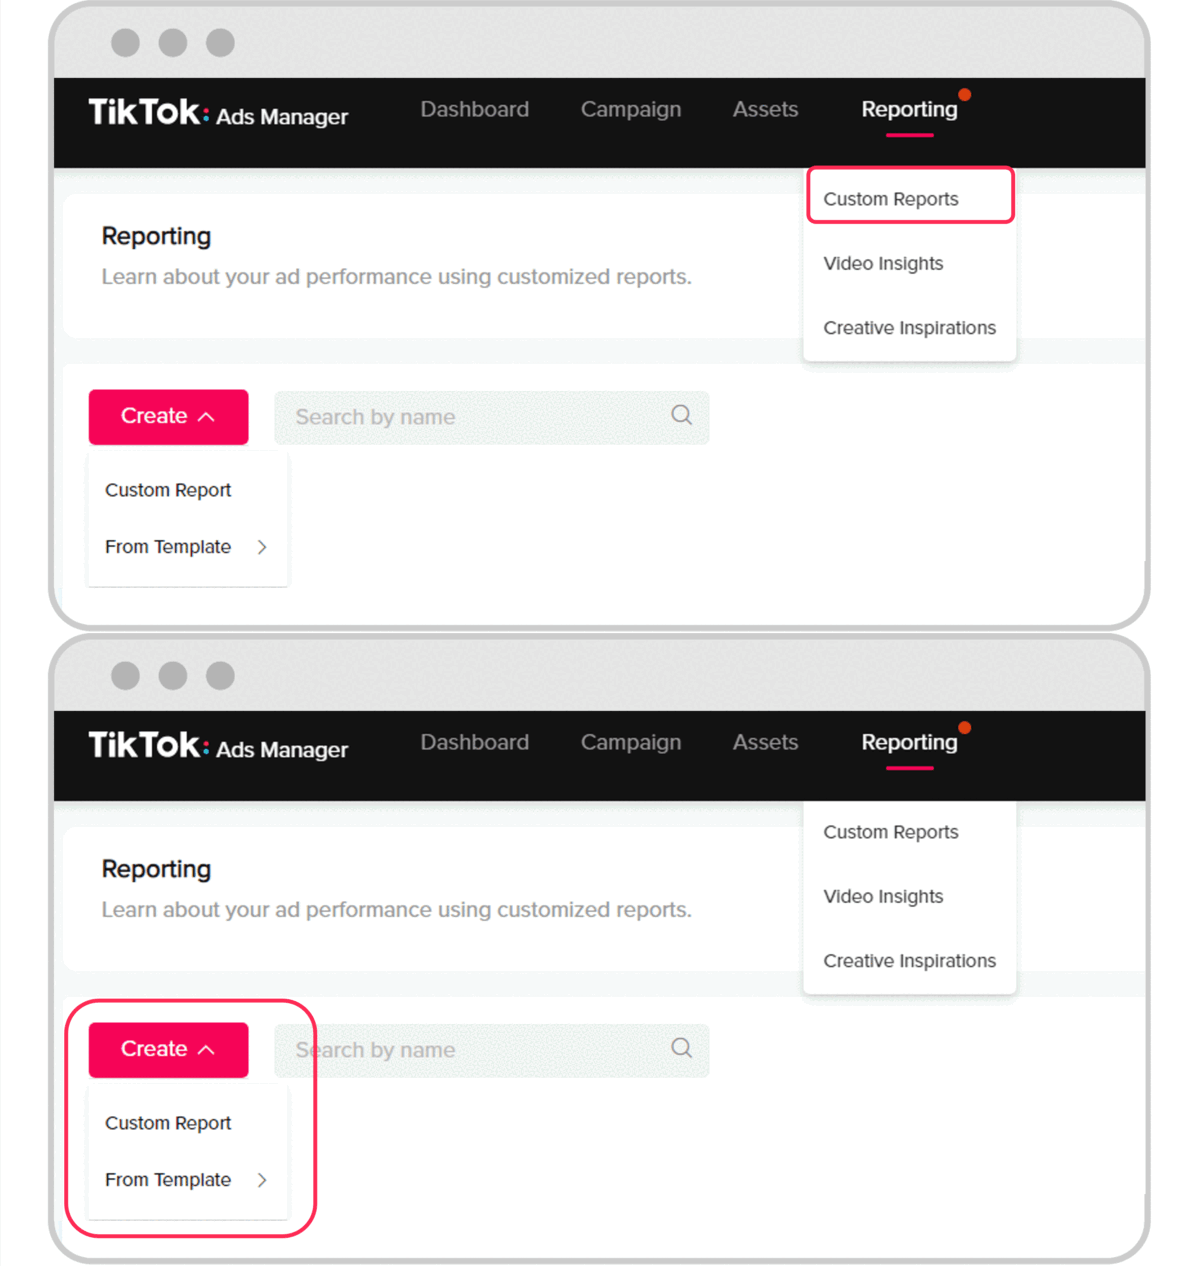
Building Custom and Templated Reports
Custom Reports allow you to create reports exactly as you want. Clicking 'Custom Report' will show you a list of Dimensions and Metrics on the left side to choose from.
> Dimensions: Row groupings of your data. For example: campaigns, ad groups, ads, placements and many other options.
> Metrics: Columns of ad performance data. For example: CPM, CPC, CTR and CVR.
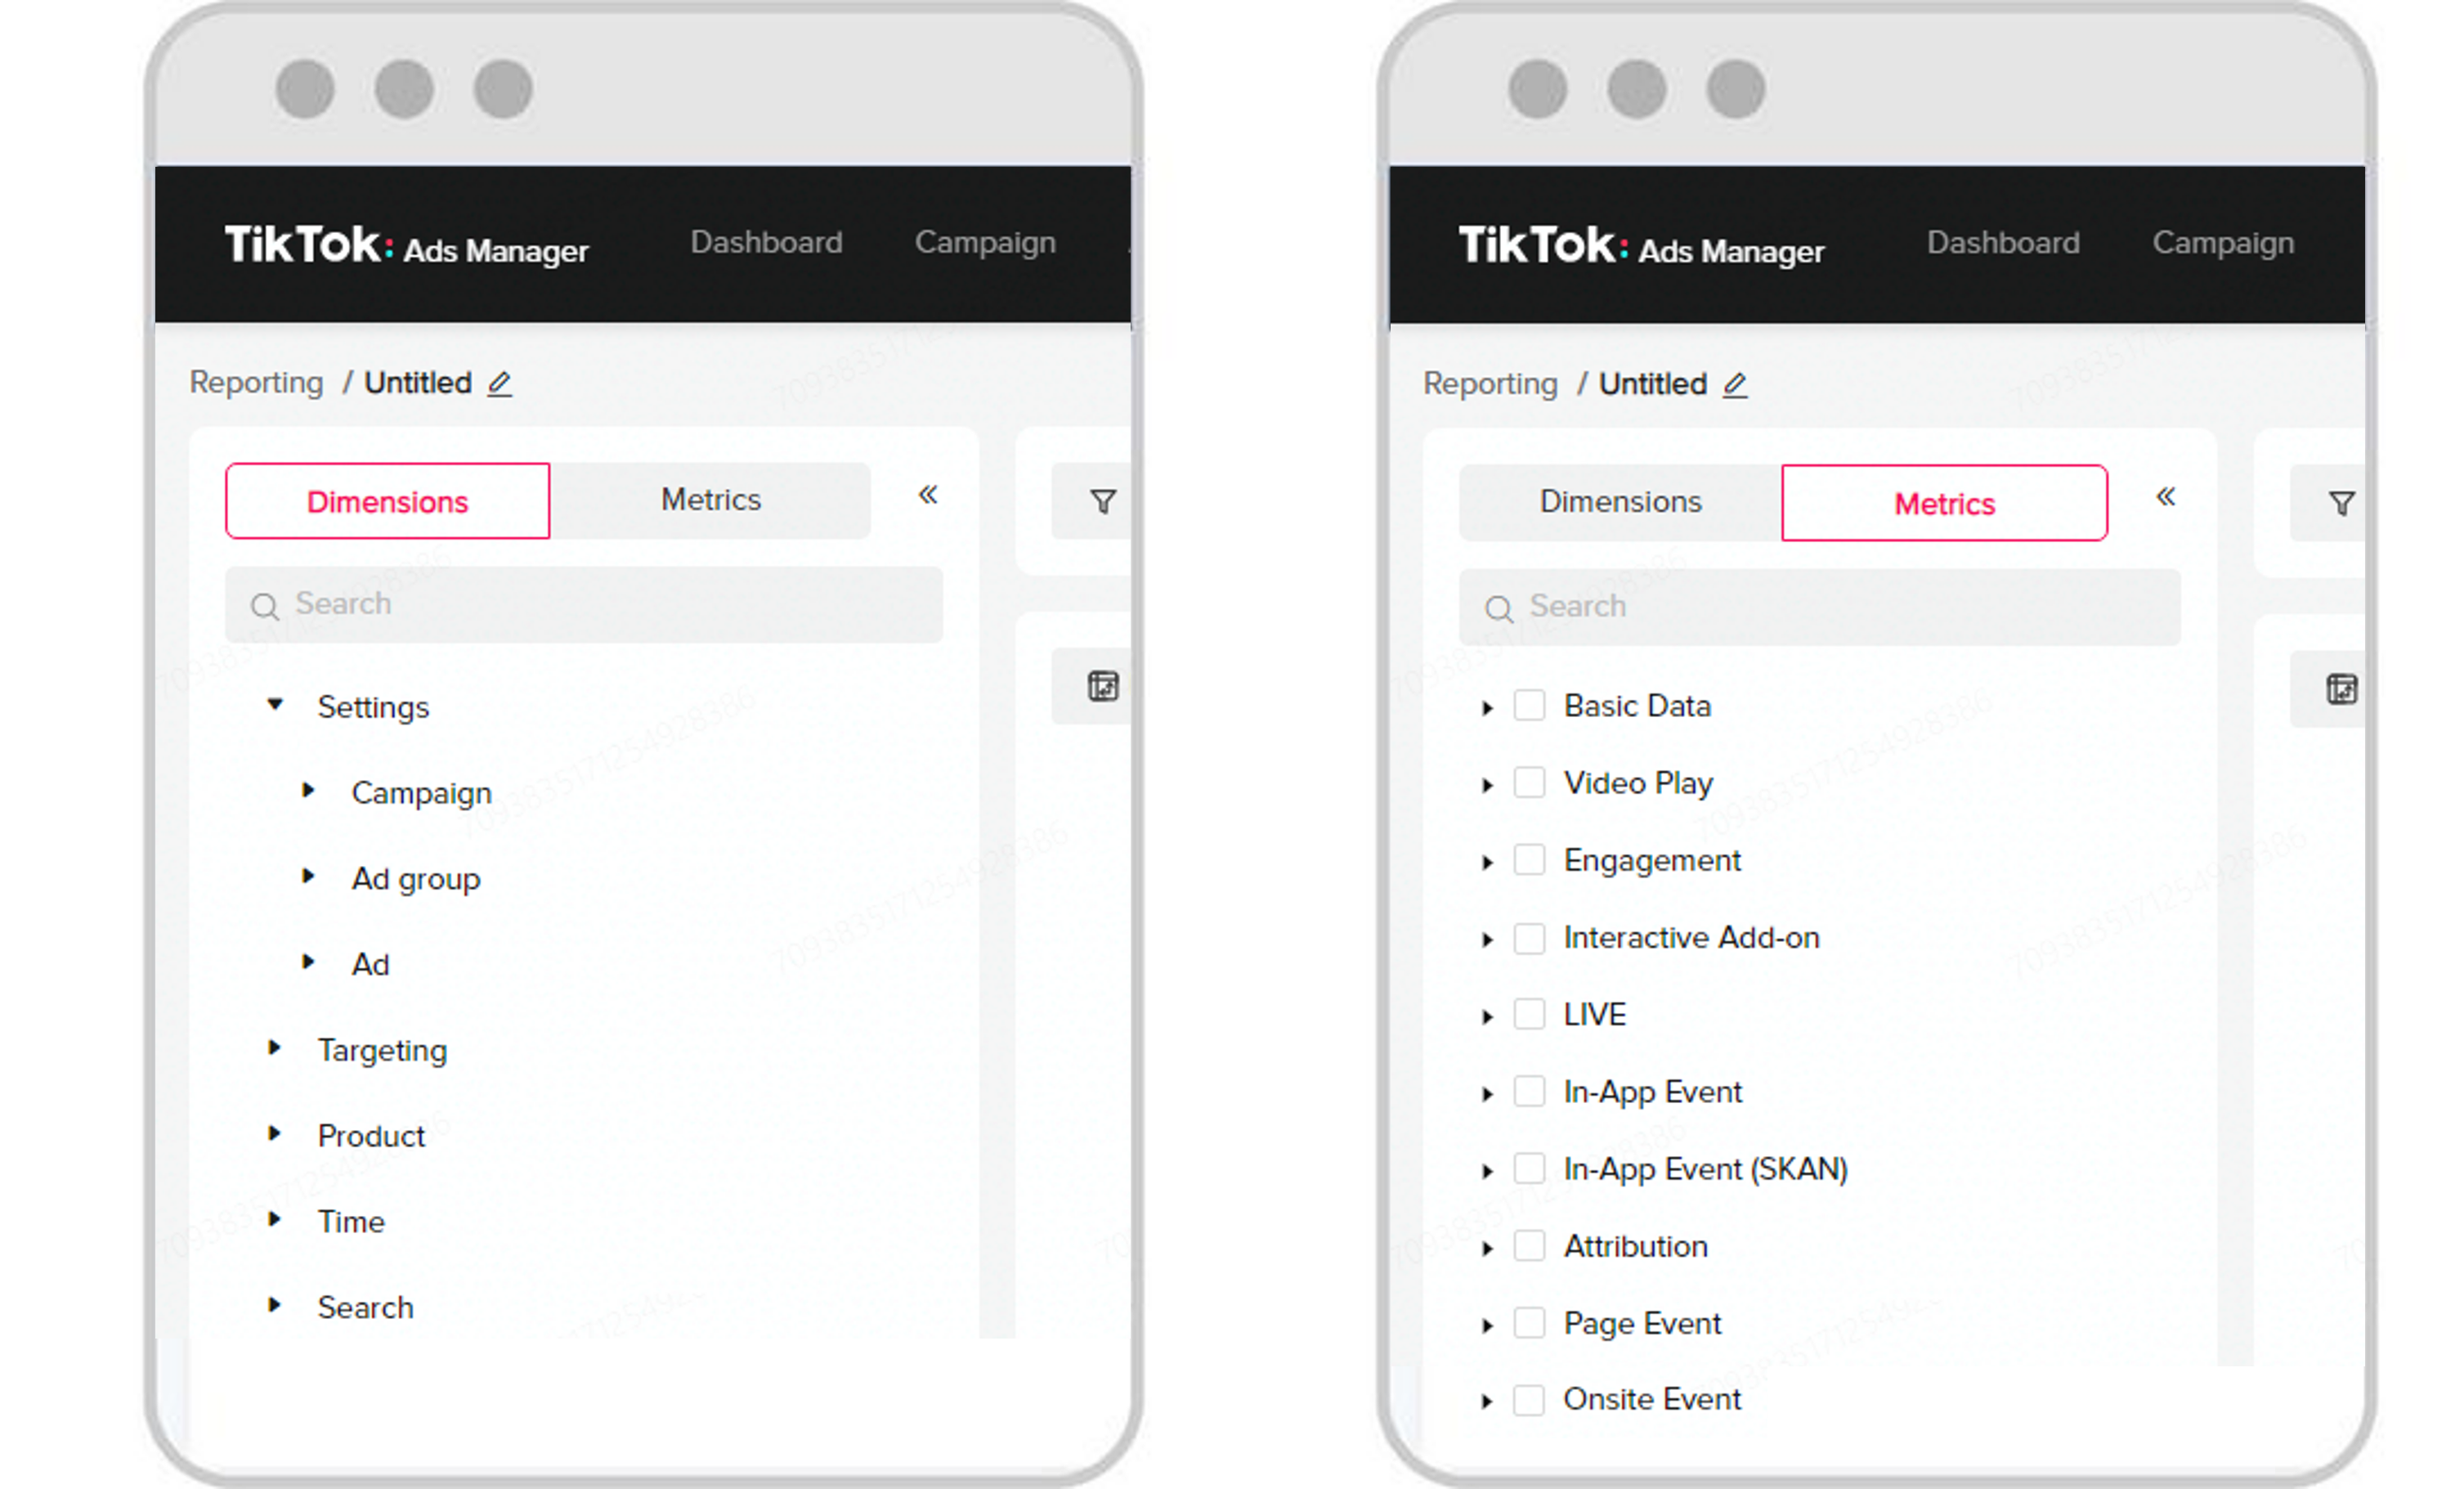
See a list of all metrics TikTok Reporting supports.
Select the Dimensions and Metrics you want to display in your report. Once selected, the data will auto-populate on the screen. You can then edit the order in which they appear in your report by dragging each option up or down.
Now that you have selected the data you want, select the time range for your data. You can select the data from yesterday, last 7 days, last 30 days, or enter a custom date range.
Need a quick report with the most common metrics? Try using our pre-defined report templates. The two templates include Ad Group Performance and Ad Performance, with the most relevant Dimensions and Metrics displayed based on which template you select. You can also add, delete or modify the Dimensions and Metrics if needed.
Once finished, click on 'Run & Export' to export your Report in xlsx or csv formats for easy reference.
Scheduling a report
To avoid constantly running and exporting reports, try out TikTok Ads Manager's Scheduled Running feature. This super useful tool allows you to set up automatically generated reports that are delivered via email.
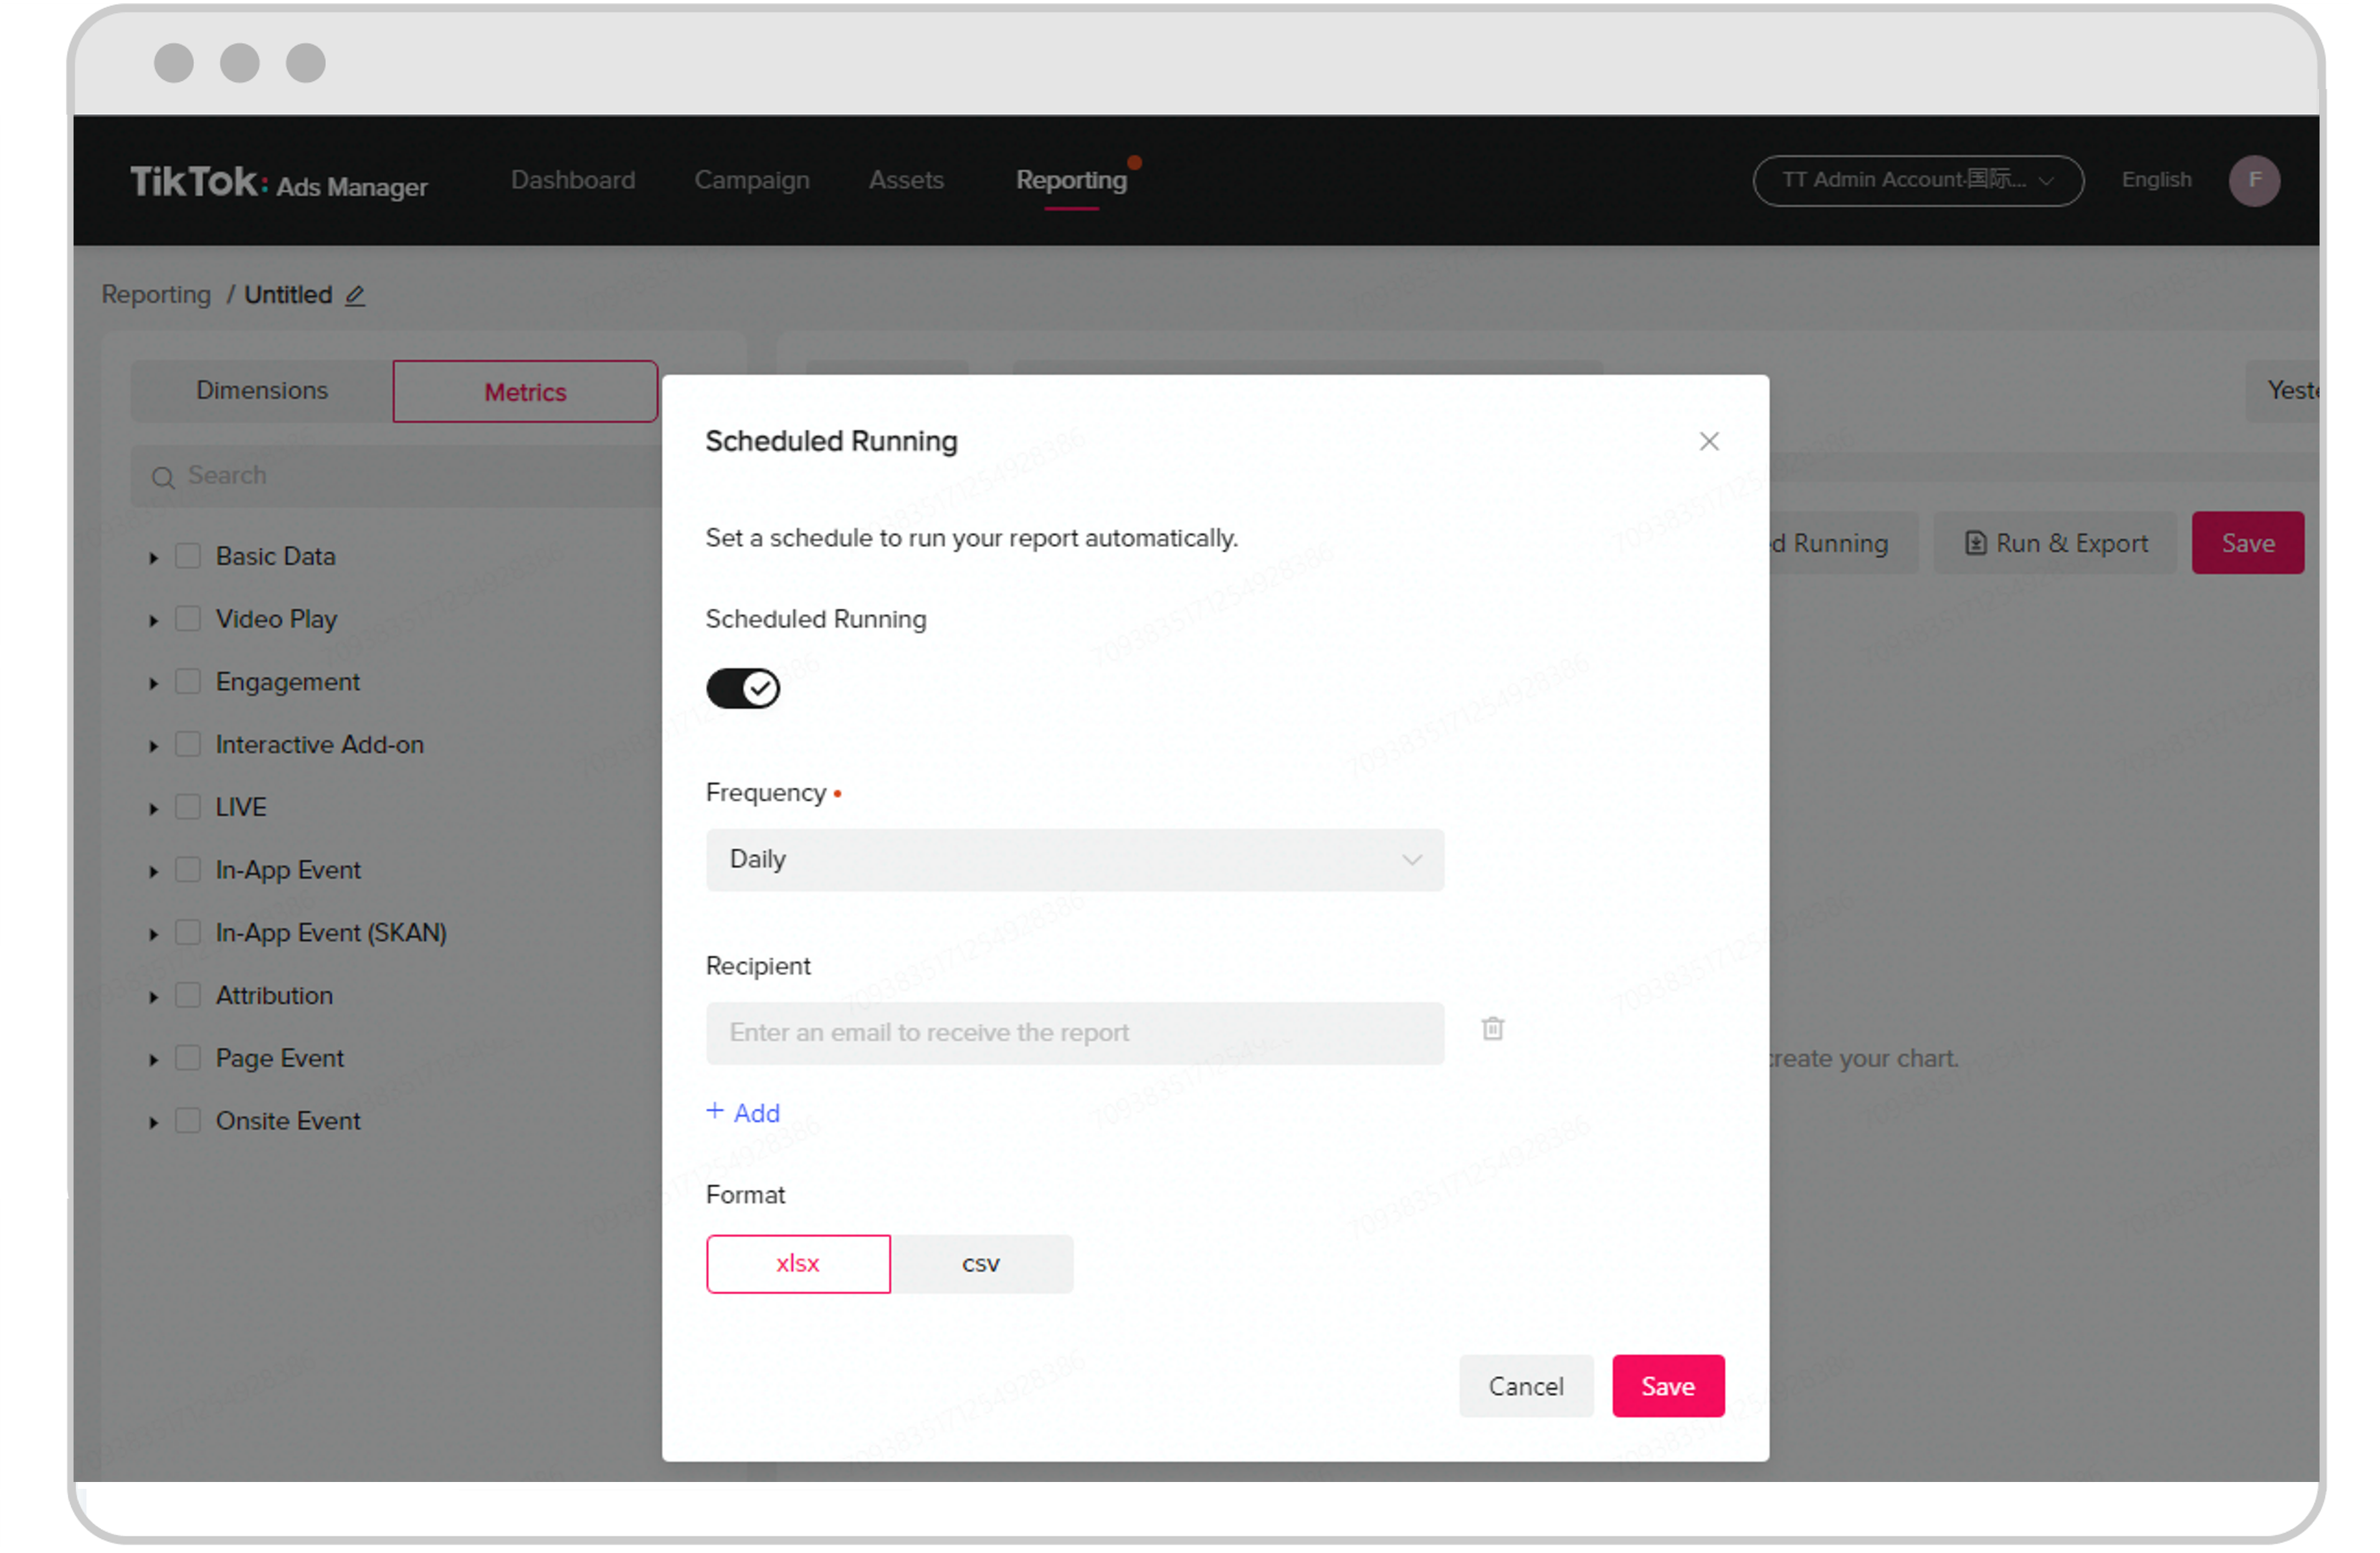
Want to include your team or boss? You can designate up to 5 emails to receive the scheduled report. Set the frequency and scheduled delivery of your reports, including daily, weekly, first day of every month and last day of every month. Note: Only users who have access to TikTok Ads Manager can download the report.
Don't forget to click 'Save' at the bottom and rename the report. Now you're all set!
Become a TikTok marketing hero
Want to put the above tips into practice? Jump into TikTok Ads Manager now and see your performance data in action!