How to see your ads performance in TikTok Ads Manager
You can see your ads performance on the Dashboard and Campaigns pages in TikTok Ads Manager. The Dashboard page shows summarized data. The Campaigns page allows you to view details or results of campaigns, ad groups, and ads.
How to see your ad performance on the Dashboard page
Click the Dashboard page from the top navigation bar in TikTok Ads Manager.
See a summary of several key performance insights, including:
Recommendations: Get our recommended actions tailored to your account.
Account overview: See a quick glance of account balance and spend.
Ad group status: View the status of all ad groups, such as active, partially delivering, and not delivering.
Performance: View summary performance metrics visualized as a trend.
Click the Calendar icon to filter the date and time of performance metrics.
Insights: Get information on top-performing ads on TikTok and audience insights.
Log: Check and monitor the operation logs of your account.
How to see your ad performance on the Campaigns page
Click the Campaigns page from the top navigation bar in TikTok Ads Manager.
Click the Campaign, Ad group, or Ad tab.
Scroll down or use the search bar to find your campaign, ad group, or ad.
Scroll to the right to view default column metrics.
You may also customize the performance metrics by clicking the Custom table dropdown on the top-right and selecting:
Pre-defined performance templates: Under Performance, you can select pre-defined performance metrics related to Shop Ads, Reach, Branded Mission, and others using template columns under More template columns.
Setup metrics: Under Settings, you can view metrics related to Setup.
Custom columns: Click the Custom Columns button to add specific metrics you would like to add to your view.
Breakdown: See your metrics broken out by Day, Week, or Month. When you select your time period for the data you want to view, you'll see an on/off toggle for Compare, where you can select two different date ranges to compare data between.
Note: If you are unable to see a breakdown, you may need to choose an active campaign, ad group, or ad.
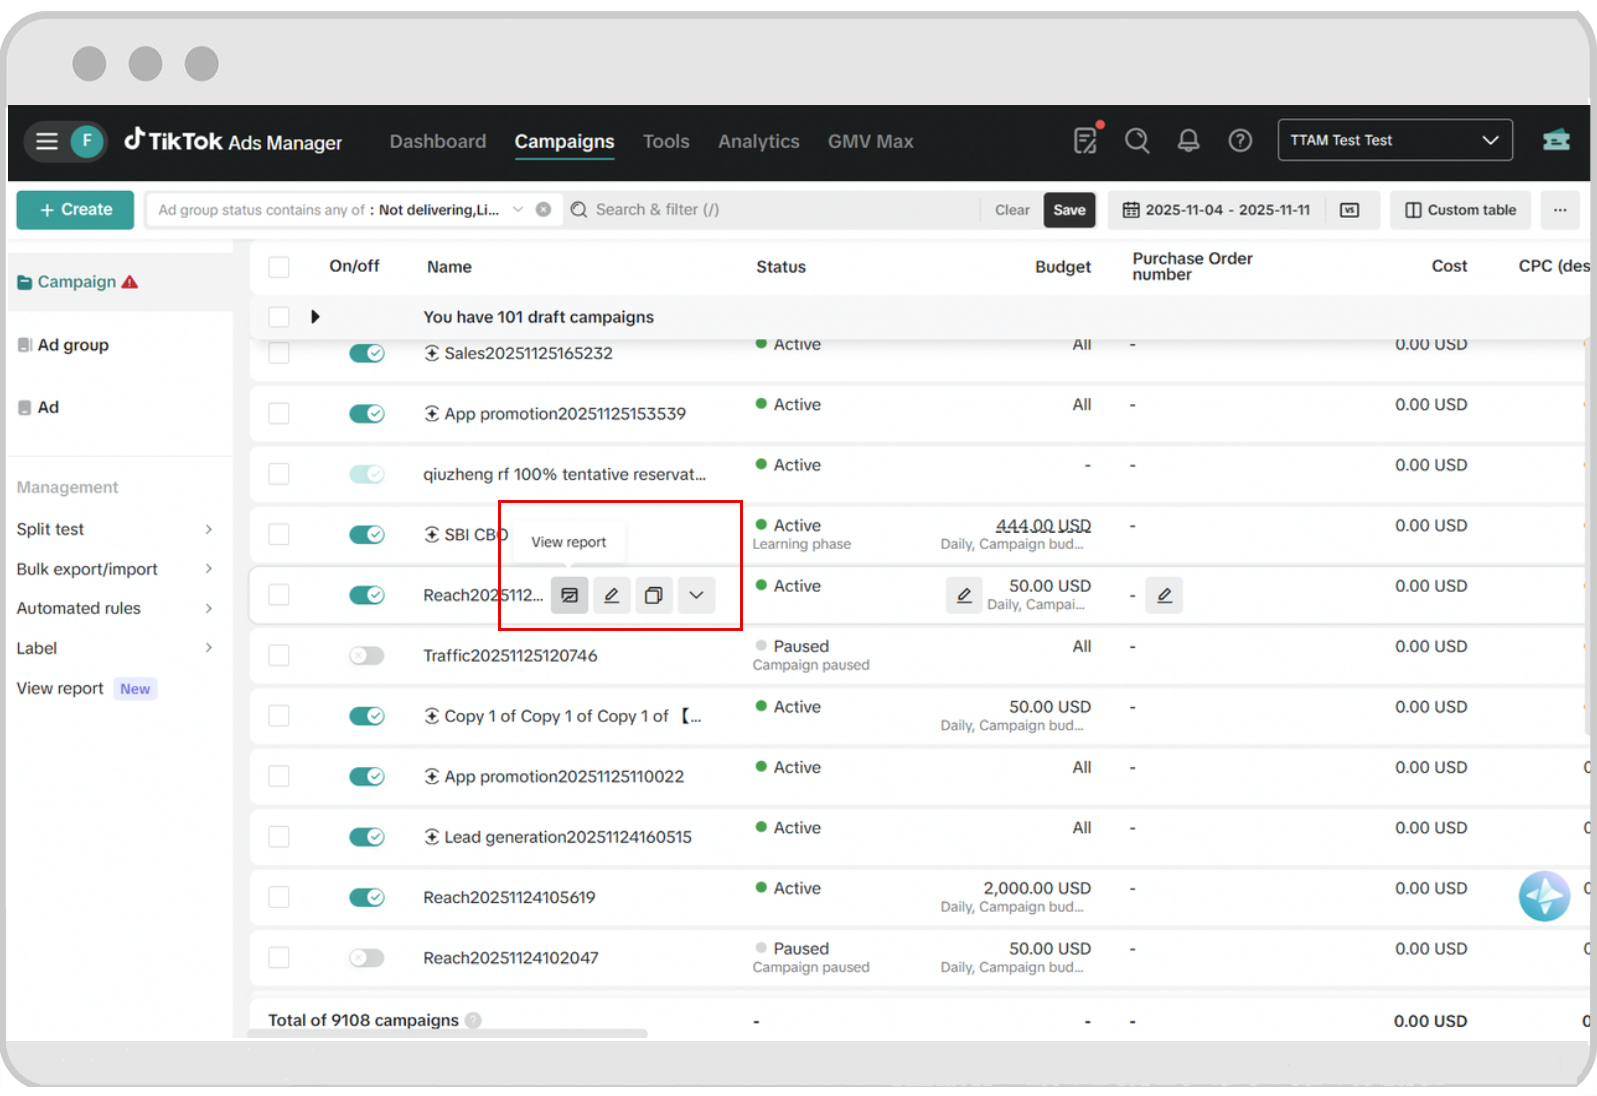
To dive into deeper daily performance metrics, audience insights, and trends in a breakout panel, you can use the view data tool or view report tool.
For an individual campaign, ad group, or ad: Hover over a campaign, ad group, or ad, and click the View data icon (or View report icon for some customers).

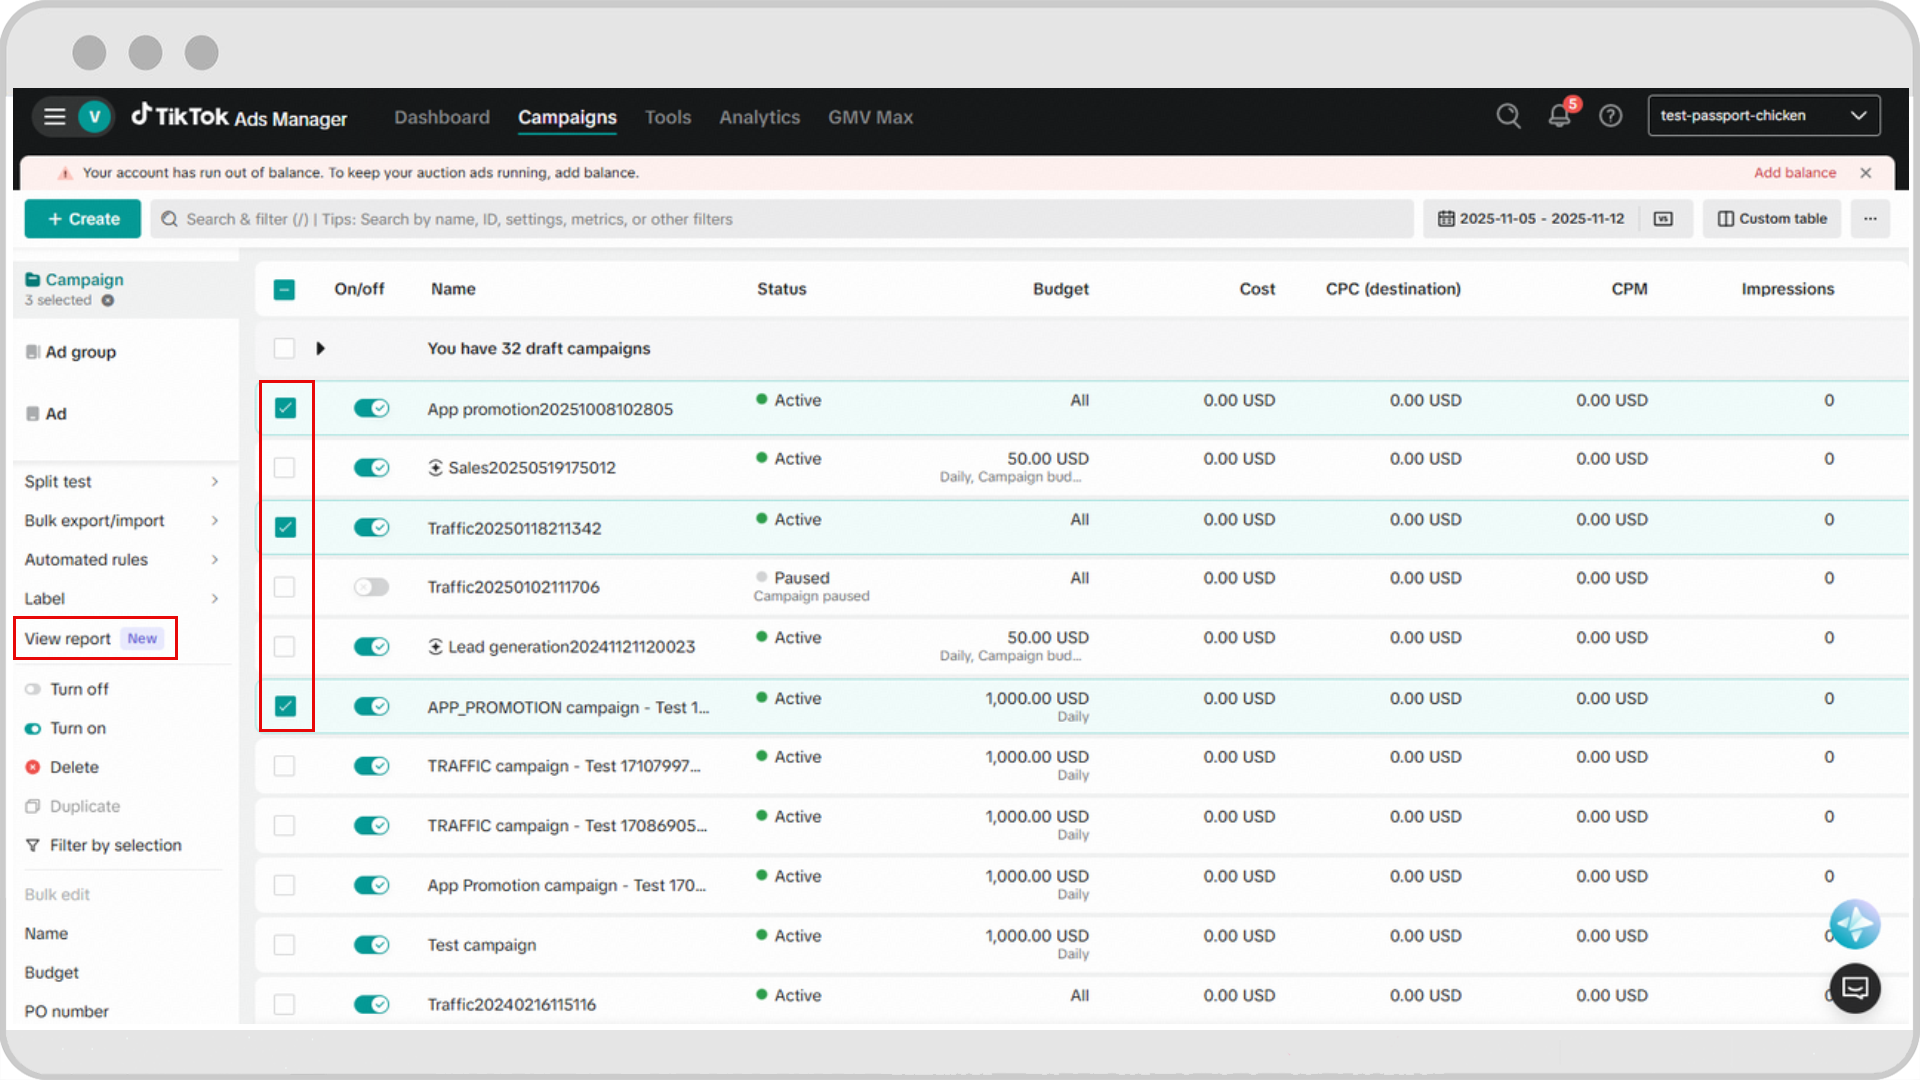
To cross-compare multiple campaigns: Select multiple campaigns and click View report on the left panel. Learn more about the view report tool. Note: Only available for campaigns and over time made available for ad groups and ads to select customers.
To export, click the three dots on the top right and click Export data.
Learn more
Learn how to create custom reports.
Learn how to see deeper insights for campaigns with the view report tool.
Learn about detailed performance insights tools, including audience insights, video insights, and attribution analytics.