Attribution Analytics - How to view Time To Conversions in TikTok Ads Manager
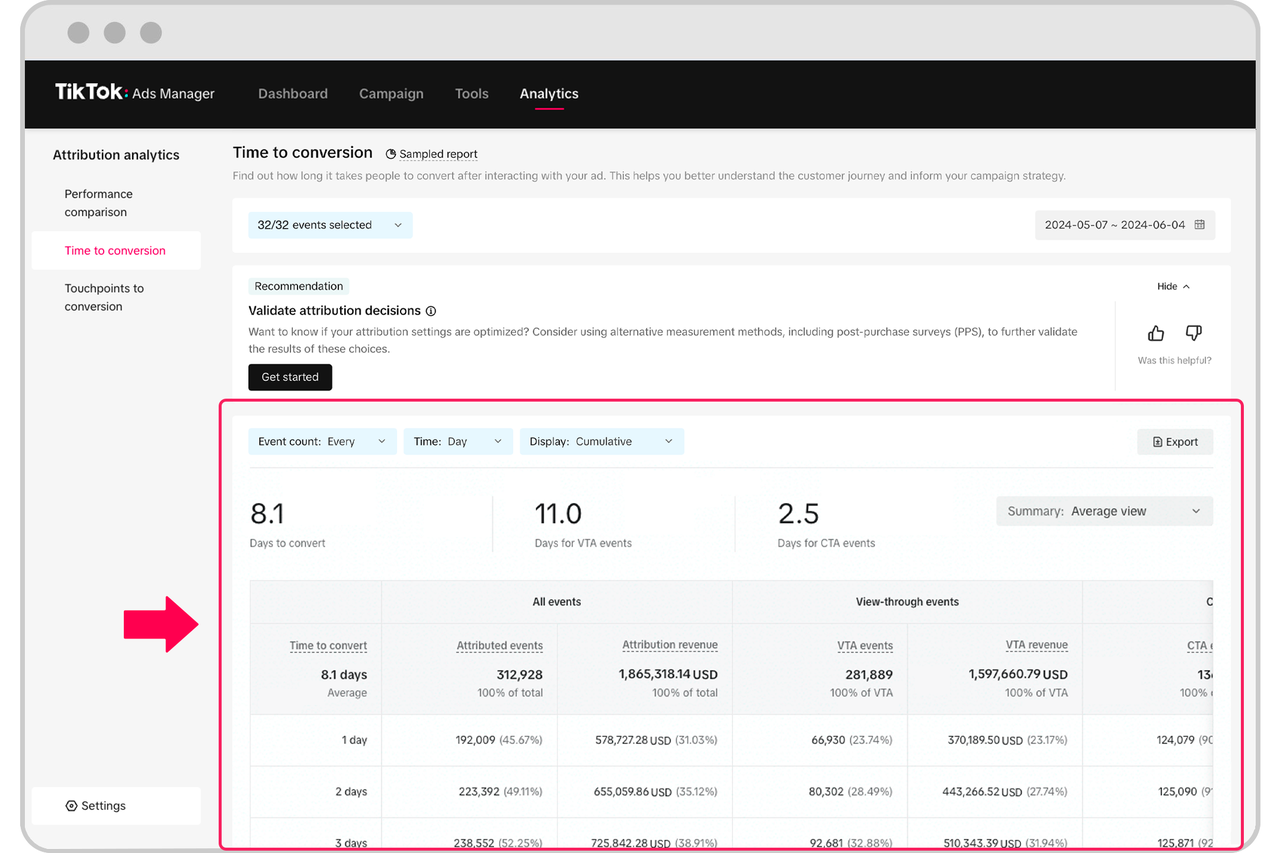
Time To Conversions provides insights into the average time it takes to convert after the last ad interaction and the number of attributed events recorded daily after ad exposure. These insights allow you to understand the average time to conversions after ad click (CTA) or ad view (VTA) and complement your paid efforts with organic strategies and discounts.
How to view Time To Conversions
To view Time to Conversions analytics:
Log in to TikTok Ads Manager.
Click Analytics.
Click Attribution analytics.
Click Time to Conversions.
Select Filters. You can choose from:
Event filter: Multi-select option to see the events you care about. For example, select Complete Payment to view only that event.
Date filter: Select the date range for which you want to see time to conversion data.
Campaigns Filter: Select the campaigns for which you would like to see the time to conversion data.
Ad group Filter: Select the ad group for which you would like to see the time to conversion data.
Based on the attributed data, we provide recommendations for your ad account. You can hide these recommendations to see the insights for time to conversion and touchpoints to conversion directly.

Conversions details
Days to convert is the average number of days it takes to capture the selected events. Average refers to the weighted average number of days to convert.For example, if you have:
Day 1: 2 conversions
Day 2: 4 conversions
Day 3: 5 conversions
Average days to convert = (1*2+2*4+3*5)/(2+4+5)
For days to convert by event type refers to the average time to convert by each event we receive pixel data for.

Deepdive view
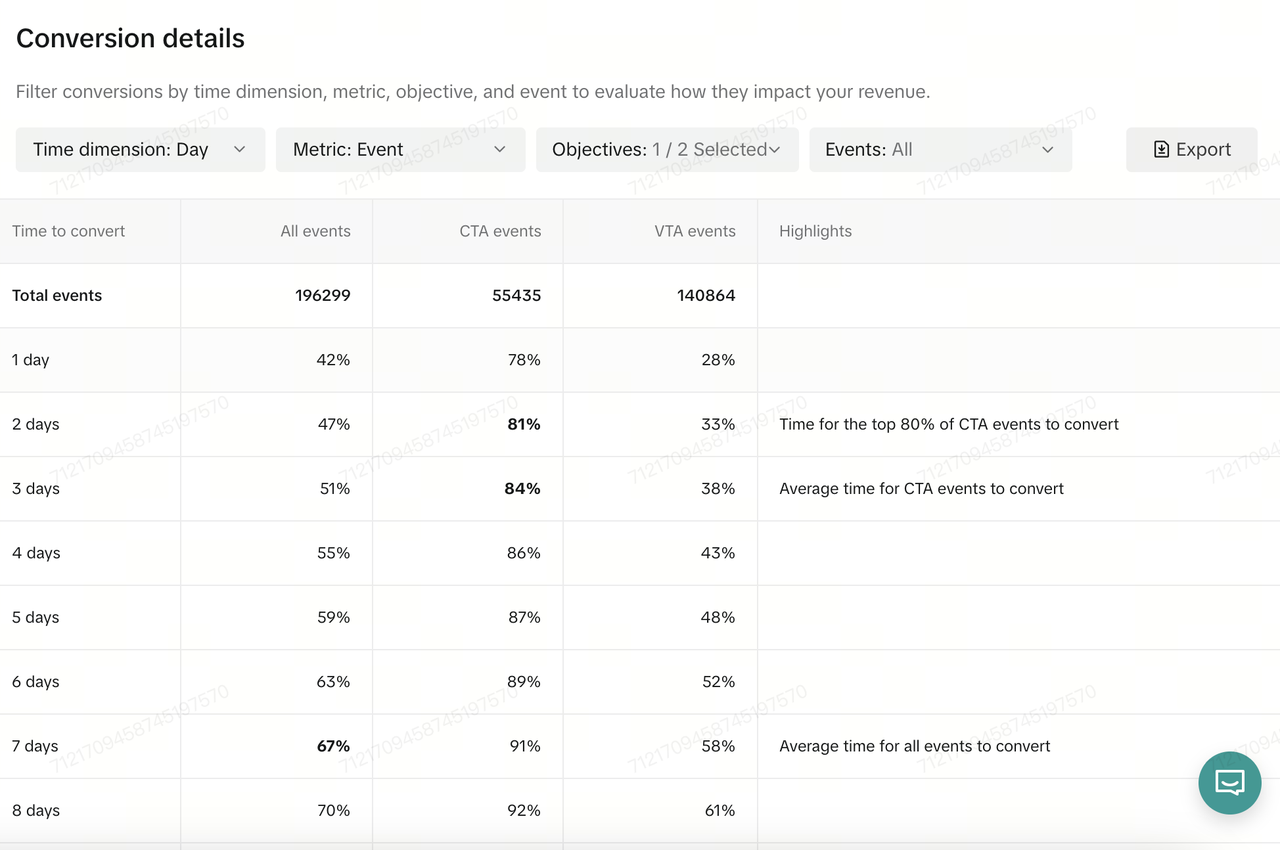
Under each objective or event type, you can see a deepdive view by clicking on the See Details section. A detailed breakdown table loads with the following filters:
Time Dimension: Hour/day
Metric: Event count/ Revenue
Objectives
Event names
The detailed table shows the % of events captured on each day/hour after ad exposure
The highlights column on the right shows which day/hour marked 80% event coverage and average event coverage
